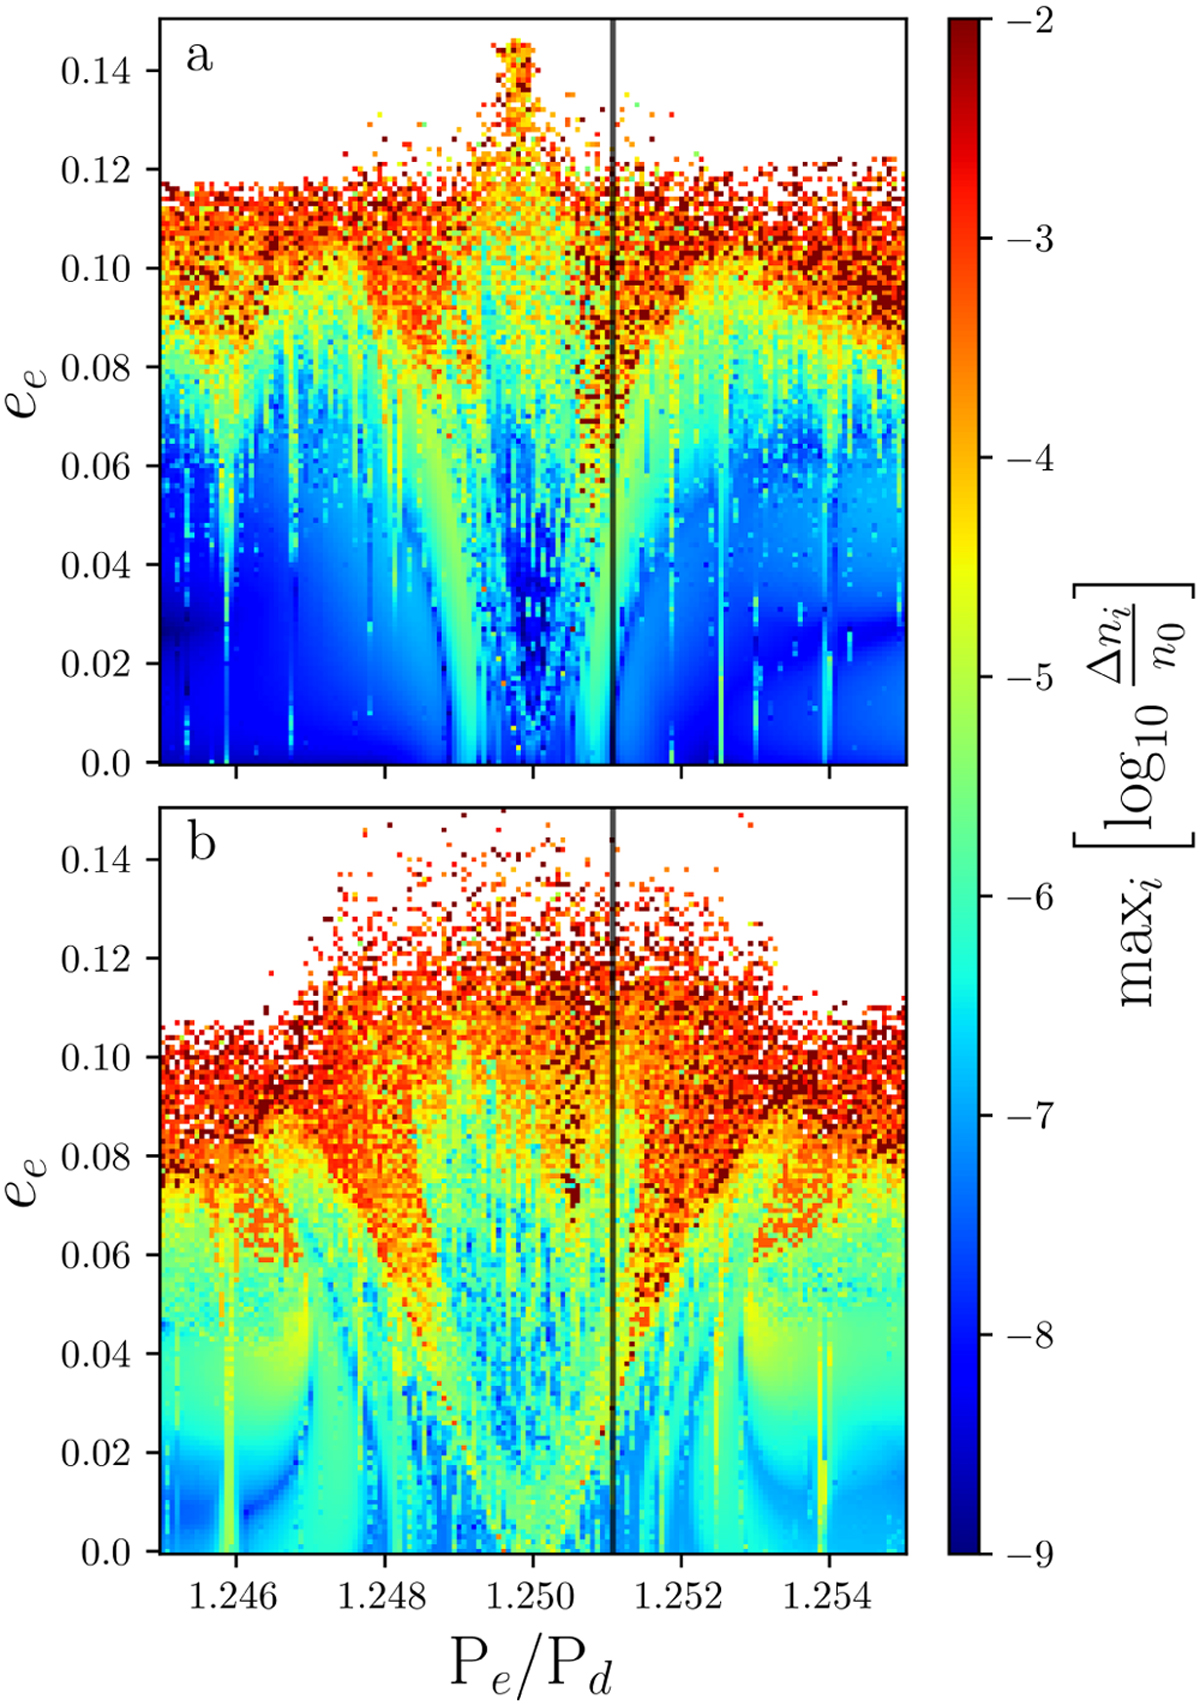
Fig. 4
Download original image
Chaoticity maps of Kepler-444 near the 5:4 MMR of the d-e planets pair. The topology of the parameter subspace is revealed by a grid of 151 × 151 system configurations and a colour code given by the level of chaos in each configuration estimated via NAFF (cf. Sect. 2.1). The redder areas correspond to strongly chaotic configurations, as opposed to the blue ones. Finally, the boxes are coloured in white if the system turned unstable before the end of the integration (either ejection or close encounter). The vertical line indicates the position of the actual planet pair on this x-axis, as tightly constrained by the transits observations. The two grids differ from each other through the masses of planets d and e. Top a: planetary masses are fixed at the median of the TTV posterior obtained by Mills & Fabrycky (2017). Bottom b: masses of planets d and e are increased to their 1σ upper limits.
Current usage metrics show cumulative count of Article Views (full-text article views including HTML views, PDF and ePub downloads, according to the available data) and Abstracts Views on Vision4Press platform.
Data correspond to usage on the plateform after 2015. The current usage metrics is available 48-96 hours after online publication and is updated daily on week days.
Initial download of the metrics may take a while.