Open Access
Fig. 3
Download original image
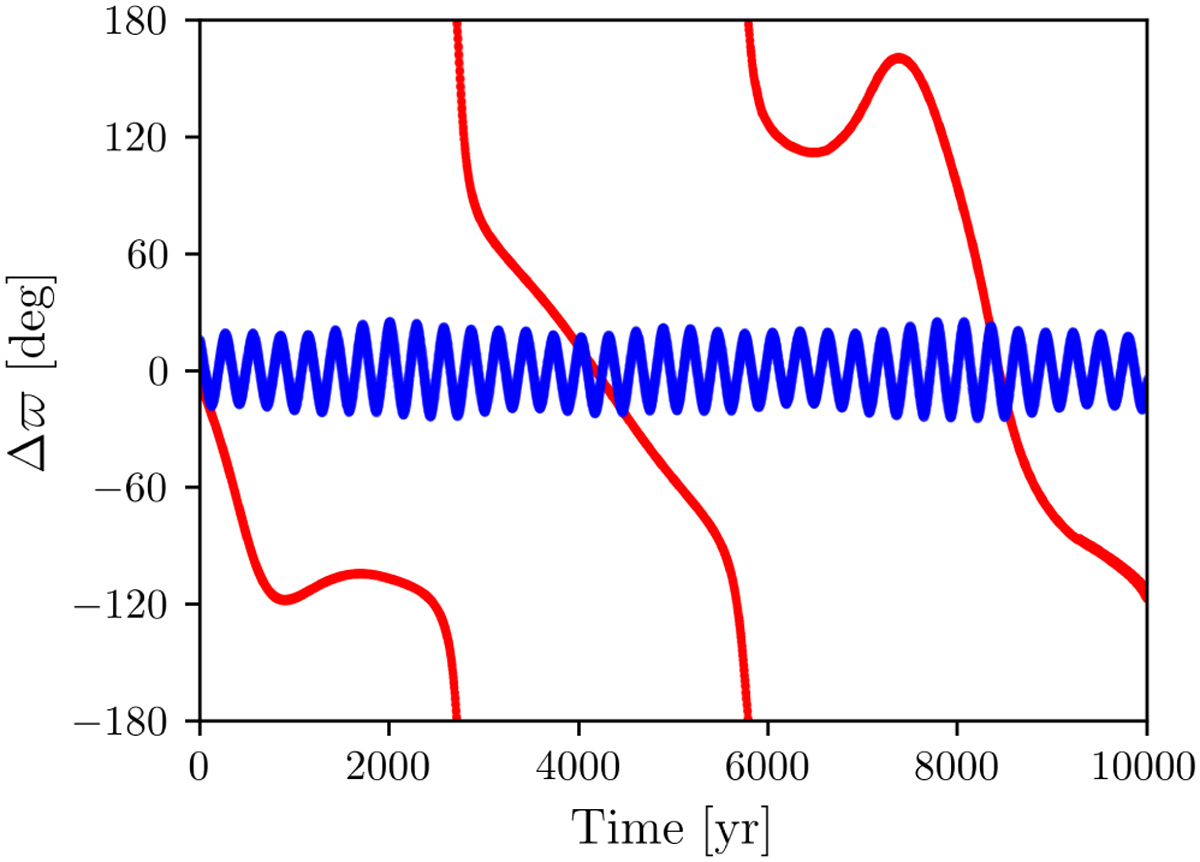
Temporal evolution of the difference in the longitudes of periastron ![]() . This plot shows the evolution of two system configurations, which illustrates the diversity of dynamical behaviours: libration (in blue) and circulation (in red).
. This plot shows the evolution of two system configurations, which illustrates the diversity of dynamical behaviours: libration (in blue) and circulation (in red).
Current usage metrics show cumulative count of Article Views (full-text article views including HTML views, PDF and ePub downloads, according to the available data) and Abstracts Views on Vision4Press platform.
Data correspond to usage on the plateform after 2015. The current usage metrics is available 48-96 hours after online publication and is updated daily on week days.
Initial download of the metrics may take a while.