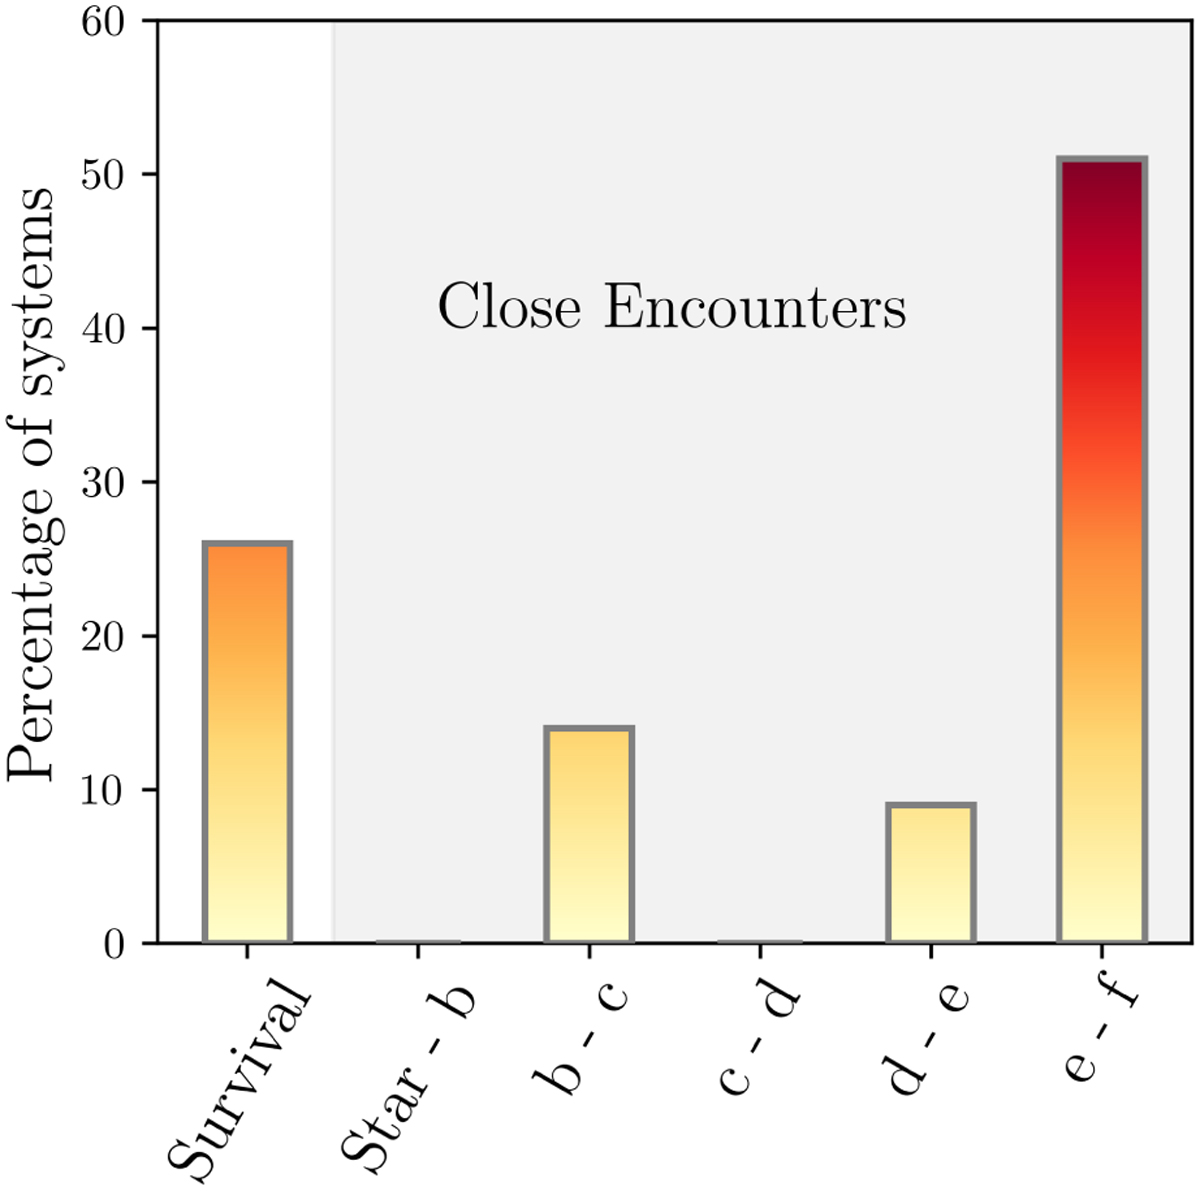
Fig. 2
Download original image
Fate of 100 system configurations that belong to the population of intermediate chaos peaking at NAFF ~ −3.5 (cf. red vertical band of Fig. 1). This bar chart distinguishes the systems that survived the 10 Myr numerical integrations from those that encountered a close encounter, after which the simulation was stopped. Among the close encounters, we further differentiate between the bodies involved in the event.
Current usage metrics show cumulative count of Article Views (full-text article views including HTML views, PDF and ePub downloads, according to the available data) and Abstracts Views on Vision4Press platform.
Data correspond to usage on the plateform after 2015. The current usage metrics is available 48-96 hours after online publication and is updated daily on week days.
Initial download of the metrics may take a while.