Fig. 3.
Download original image
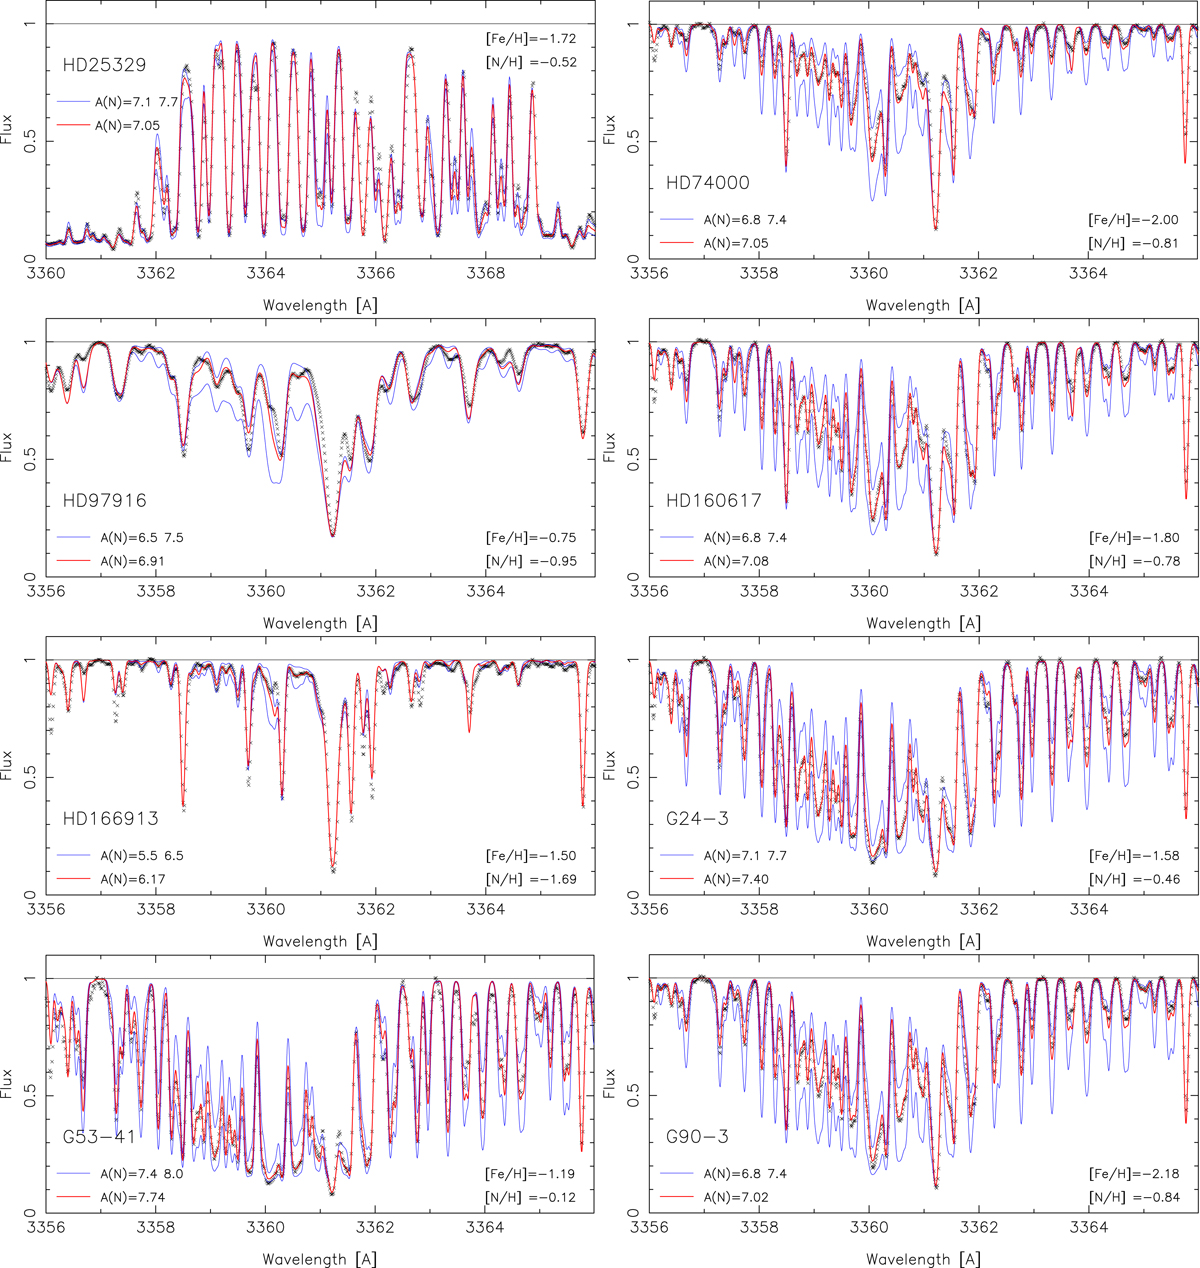
Fit of NH band in our sample of stars known or suspected to be N-rich. The small black crosses are the observed spectrum. The red line represents the best fit of the observed spectrum, and the blue lines show synthetic spectra computed with two different values of A(N) indicated on the figure. For HD 25329, the cooler dwarf of our sample, the region between 3358 and 3362 Å is saturated, and thus we fitted the observed spectra between 3366 and 3369 Å. The values of [Fe/H] and [N/H] are indicated for each star in the figure.
Current usage metrics show cumulative count of Article Views (full-text article views including HTML views, PDF and ePub downloads, according to the available data) and Abstracts Views on Vision4Press platform.
Data correspond to usage on the plateform after 2015. The current usage metrics is available 48-96 hours after online publication and is updated daily on week days.
Initial download of the metrics may take a while.