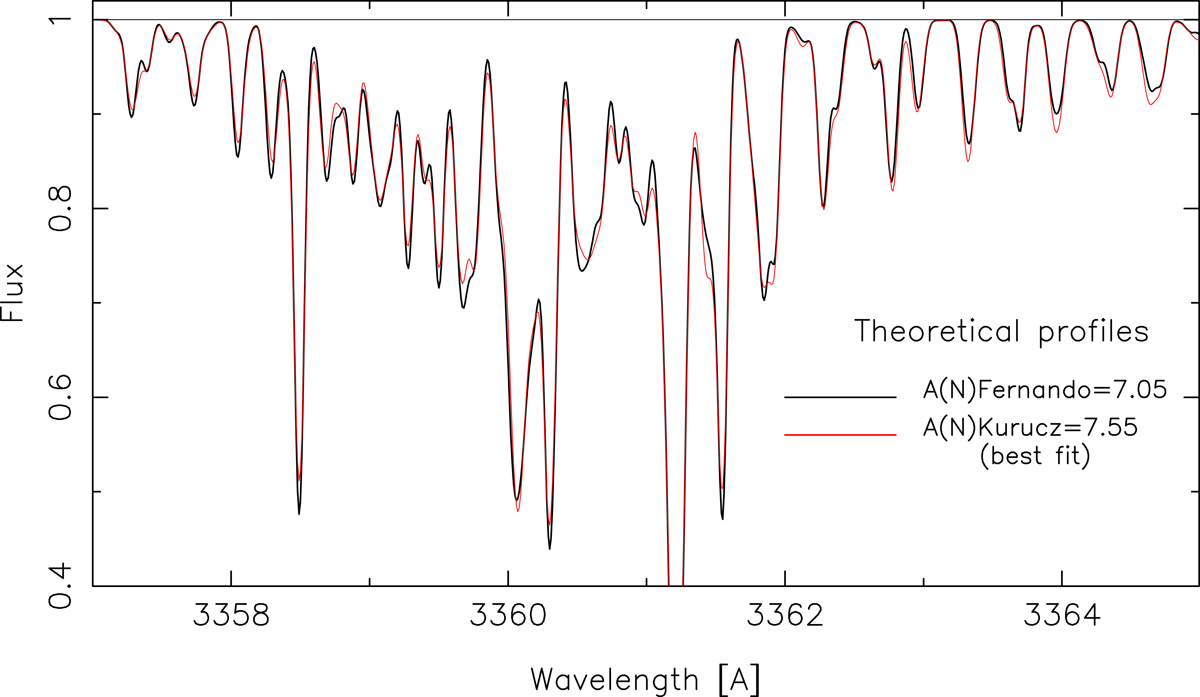
Fig. 2.
Download original image
Fit of theoretical NH band computed from the Fernando et al. (2018) data (black line) with A(N)=7.05 and the parameters of HD 74000, with synthetic spectra computed from Kurucz data. The best fit in the total interval 3357–3365 Å is obtained with A(N)=7.55 (red line). In this region, the mean difference of the N abundance computed with these two different sets of data is thus 0.50.
Current usage metrics show cumulative count of Article Views (full-text article views including HTML views, PDF and ePub downloads, according to the available data) and Abstracts Views on Vision4Press platform.
Data correspond to usage on the plateform after 2015. The current usage metrics is available 48-96 hours after online publication and is updated daily on week days.
Initial download of the metrics may take a while.