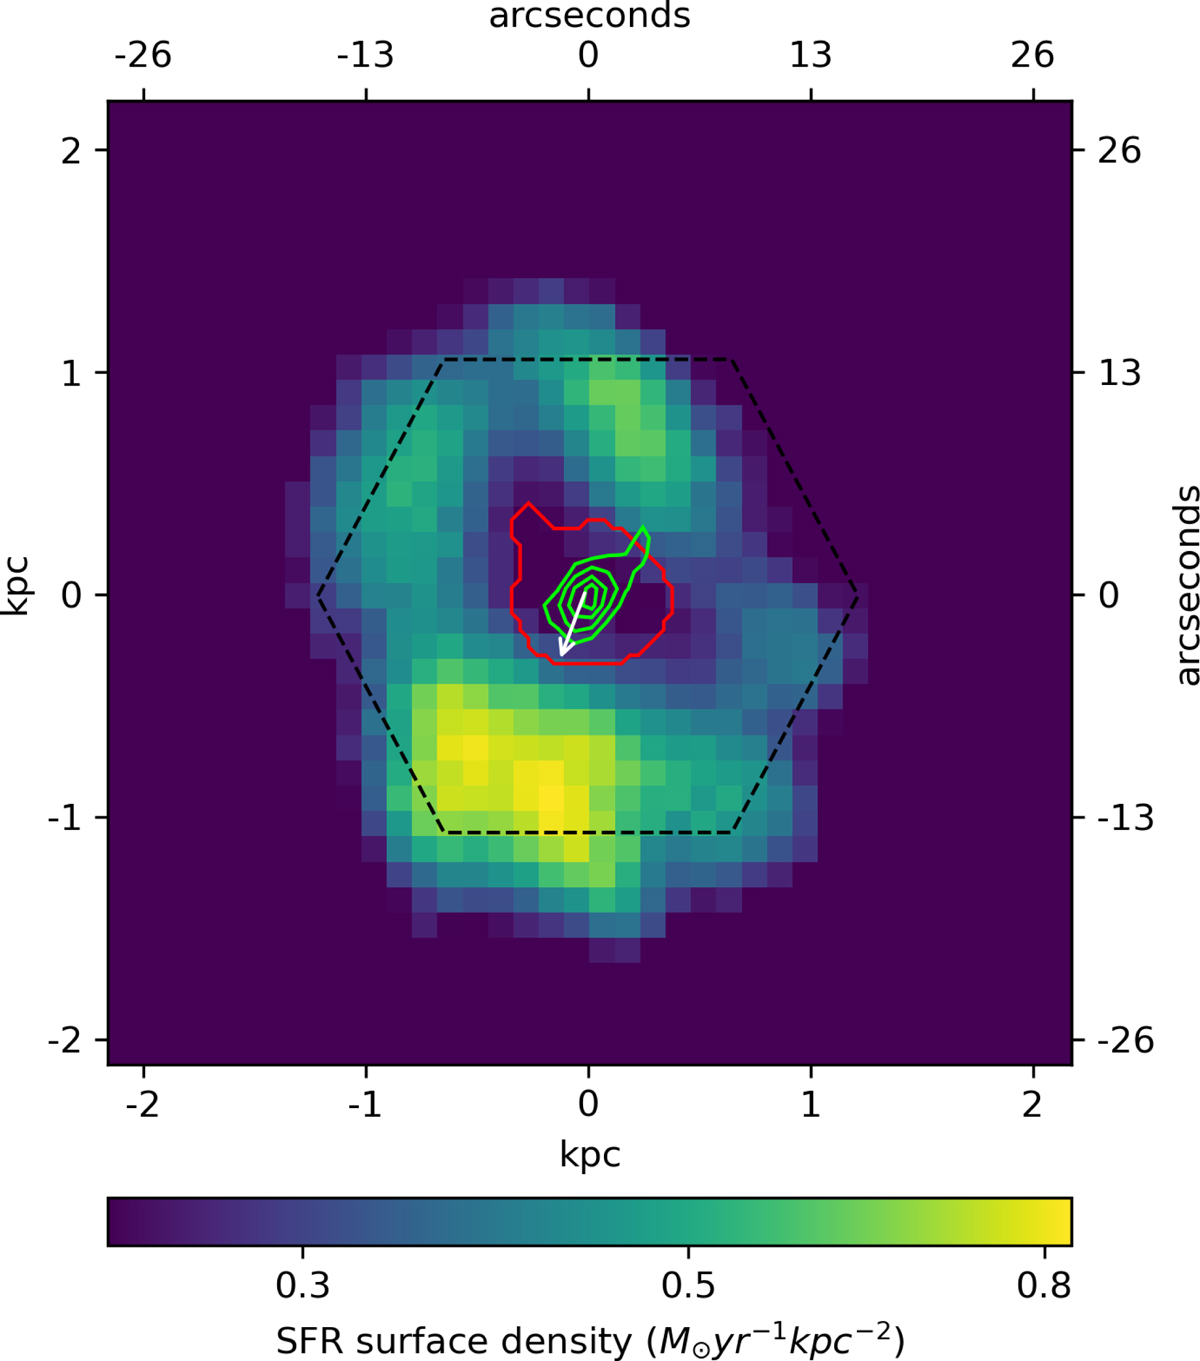
Fig. 5.
Download original image
GALEX NUV image of NGC 3982. The NUV image pixels in count rates have been converted to SFR surface densities in M⊙ yr−1 kpc−2. The red contour represents the area encompassing the composite and AGN regions in Fig. 3. The dashed black hexagon is the MaNGA IFU field of view. VLASS2.1 radio contours (green) with contour levels 0.0007, 0.0012, 0.0018, and 0.0024 Jy beam−1 and a beamwidth of ∼2.5 arcsec are overlaid on the figure. The radio data reveal an elongated structure lying in the south-east to north-west direction. The VLBI-detected jet or outflow direction is shown as a vector (white) for comparison. The vector has an origin at the flat spectrum core profile detected by Bontempi et al. (2012), and it points in the direction of their detected steep spectrum feature.
Current usage metrics show cumulative count of Article Views (full-text article views including HTML views, PDF and ePub downloads, according to the available data) and Abstracts Views on Vision4Press platform.
Data correspond to usage on the plateform after 2015. The current usage metrics is available 48-96 hours after online publication and is updated daily on week days.
Initial download of the metrics may take a while.