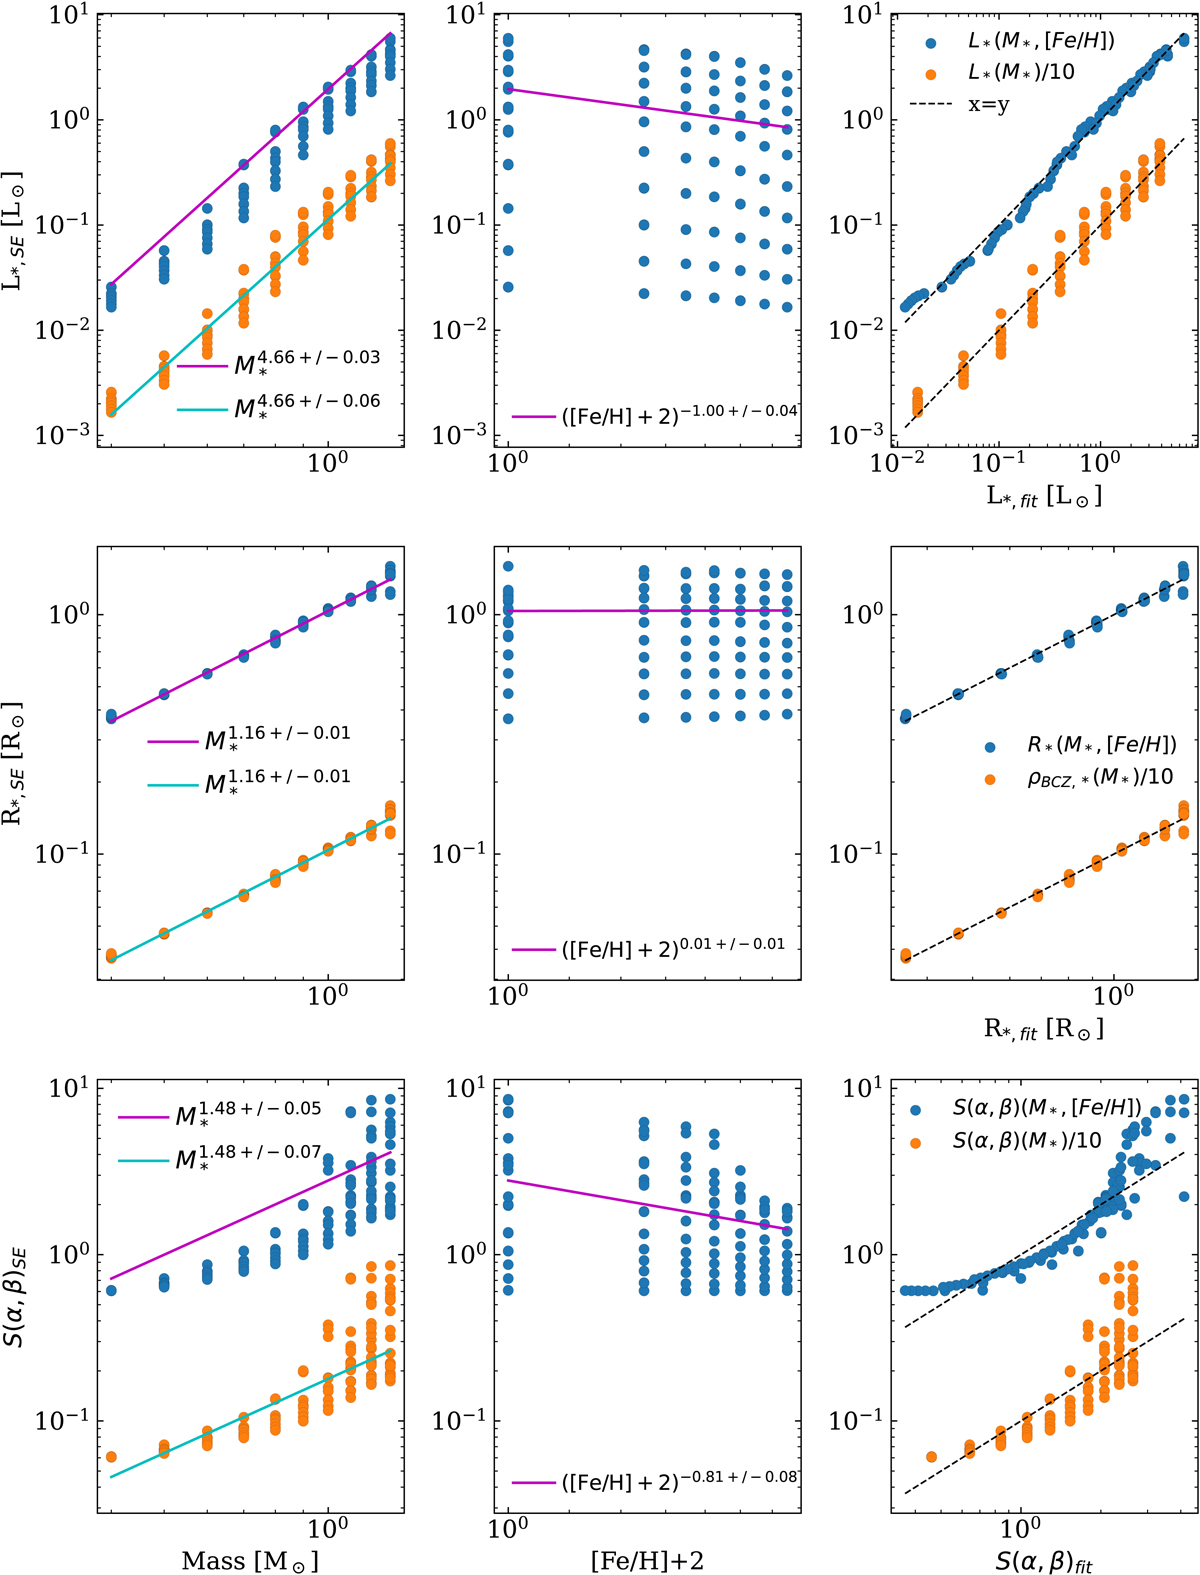
Fig. C.1.
Download original image
Linear regressions for determining the homology relations of Eqs. 3 and 19 and the structure term S(α, β) as defined in Eq. 13 and 20. We use the grid evolutionary track of A19 taken from the STAREVOL (SE) code. Each dot represents one of these stellar tracks, from which different values have been deduced as mean value during their MS (subscript SE). The first row shows L*, the second row shows R*, and the third row shows S(α, β). The first column illustrates these different values as a function of M*, and the second column shows them as a function of ([Fe/H] + 2). The third column illustrates the quality of the fits. It represents the different original values (L*, R*, and S(α, β)) as functions of the values that were estimated by the fits (subscript fit). These regressions are illustrated in the first and second columns. They are shown in purple if they are multiparametric (as a function of M* and [Fe/H]) and in cyan when they are only a regression on M*. Blue dots represent models on which we perform the multiparametric regression, and the orange group represents models on which we only fit on M*. For the latter, we divided the values by 10 for illustration purposes.
Current usage metrics show cumulative count of Article Views (full-text article views including HTML views, PDF and ePub downloads, according to the available data) and Abstracts Views on Vision4Press platform.
Data correspond to usage on the plateform after 2015. The current usage metrics is available 48-96 hours after online publication and is updated daily on week days.
Initial download of the metrics may take a while.