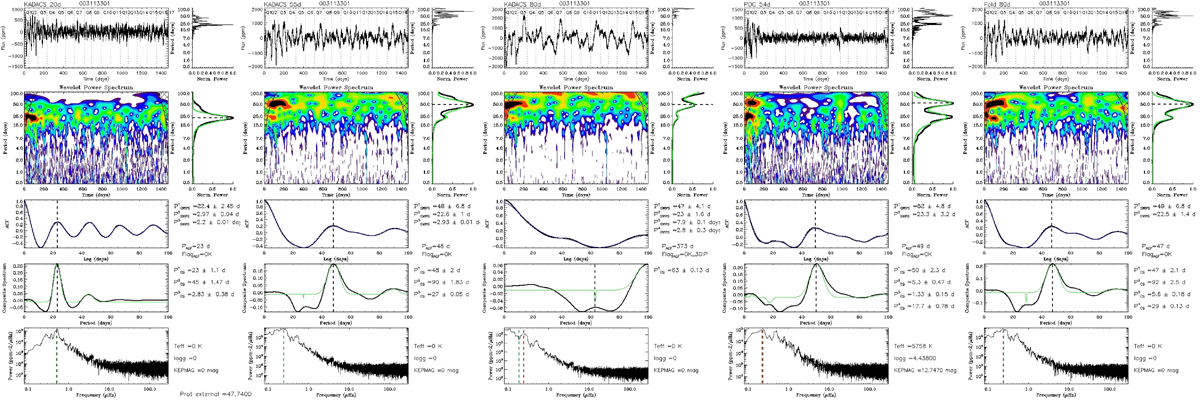
Fig. B.2.
Download original image
Example of one of the control plots for KIC 3113301. It contains the output of our rotation pipeline (see S19-21) for the three KEPSEISMIC light curves in S19-21 (filtered at 20, 55, and 80d) for the PDC-MAP light curve (which in this example clearly filters the stellar rotation signature), and for the new KEPSEISMIC light curve filtered at 80 days in which the modulation related to PKepler is removed. For a full description of the plots, we refer to S19-21. Briefly, from top to bottom we show the light curve and the Lomb-Scargle periodogram, the time-period analysis with the global wavelet power spectrum (GWPS), the ACF, the CS, and the full power spectrum density (PSD) in log-log scale.
Current usage metrics show cumulative count of Article Views (full-text article views including HTML views, PDF and ePub downloads, according to the available data) and Abstracts Views on Vision4Press platform.
Data correspond to usage on the plateform after 2015. The current usage metrics is available 48-96 hours after online publication and is updated daily on week days.
Initial download of the metrics may take a while.