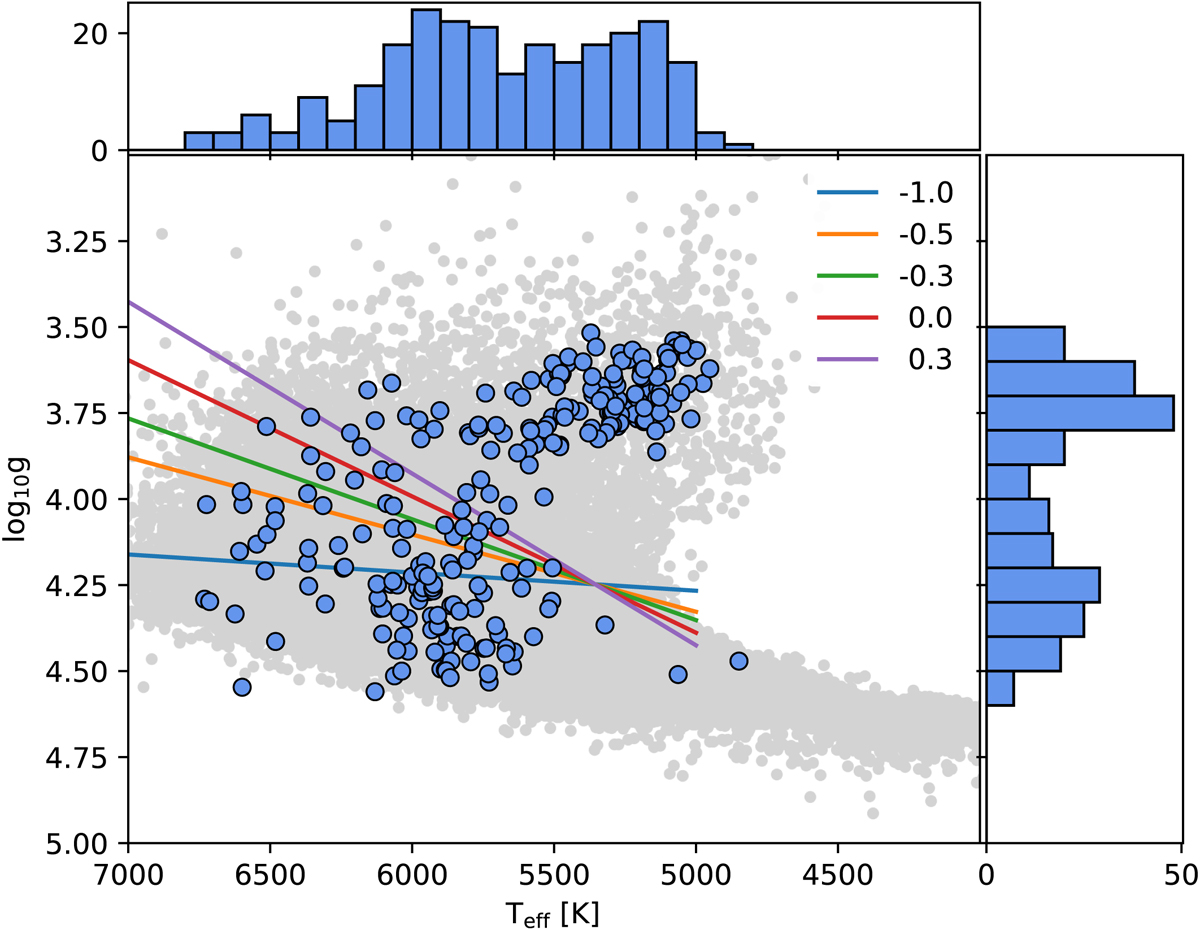
Fig. A.2.
Download original image
Kiel diagram of the optimistic sample by applying Eq. 25 to the whole S19-21 rotation catalog before filtering masses, metallicities, and subgiants and before individual inspections. Histograms are illustrated in blue on both axes for the selected targets. We show subgiant cuts for different metallicities computed with Eq. A.2 in the same diagram.
Current usage metrics show cumulative count of Article Views (full-text article views including HTML views, PDF and ePub downloads, according to the available data) and Abstracts Views on Vision4Press platform.
Data correspond to usage on the plateform after 2015. The current usage metrics is available 48-96 hours after online publication and is updated daily on week days.
Initial download of the metrics may take a while.