Fig. 2.
Download original image
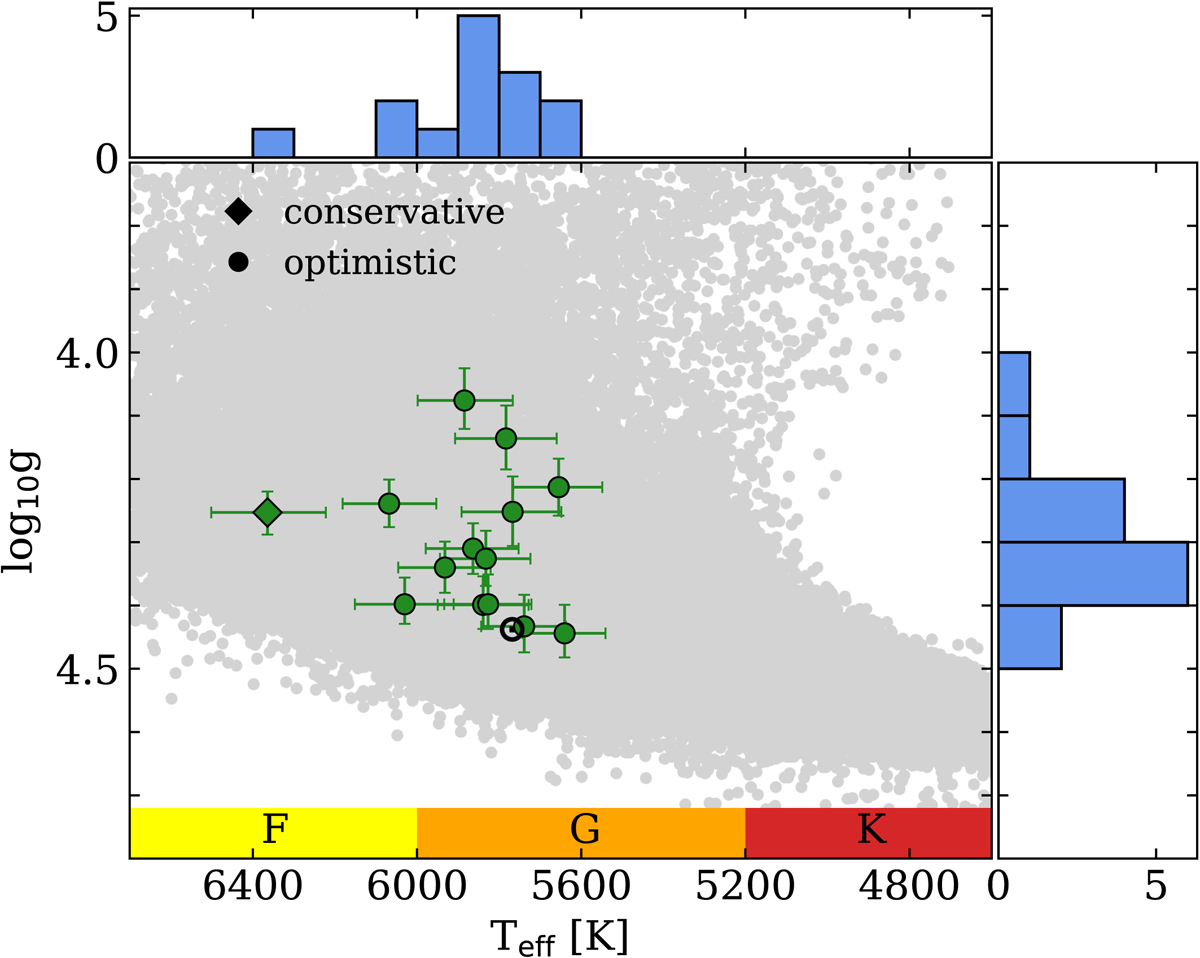
Kiel diagram (Teff vs. log10g) for anti-solar DR candidates at solar metallicity. The conservative and optimistic samples are illustrated with green diamonds and circles, respectively. The circled dot represents the Sun, and spectral types are indicated on the Teff-axis. Spectral types are defined here with the standard Harvard Spectral Classification (see, e.g., Habets & Heintze 1981 for more details). Histograms on the x- and y-axes correspond to the Teff and log10g distributions for the candidates shown in green. We illustrate all rotators from the S19-21 catalog with gray dots for comparison.
Current usage metrics show cumulative count of Article Views (full-text article views including HTML views, PDF and ePub downloads, according to the available data) and Abstracts Views on Vision4Press platform.
Data correspond to usage on the plateform after 2015. The current usage metrics is available 48-96 hours after online publication and is updated daily on week days.
Initial download of the metrics may take a while.