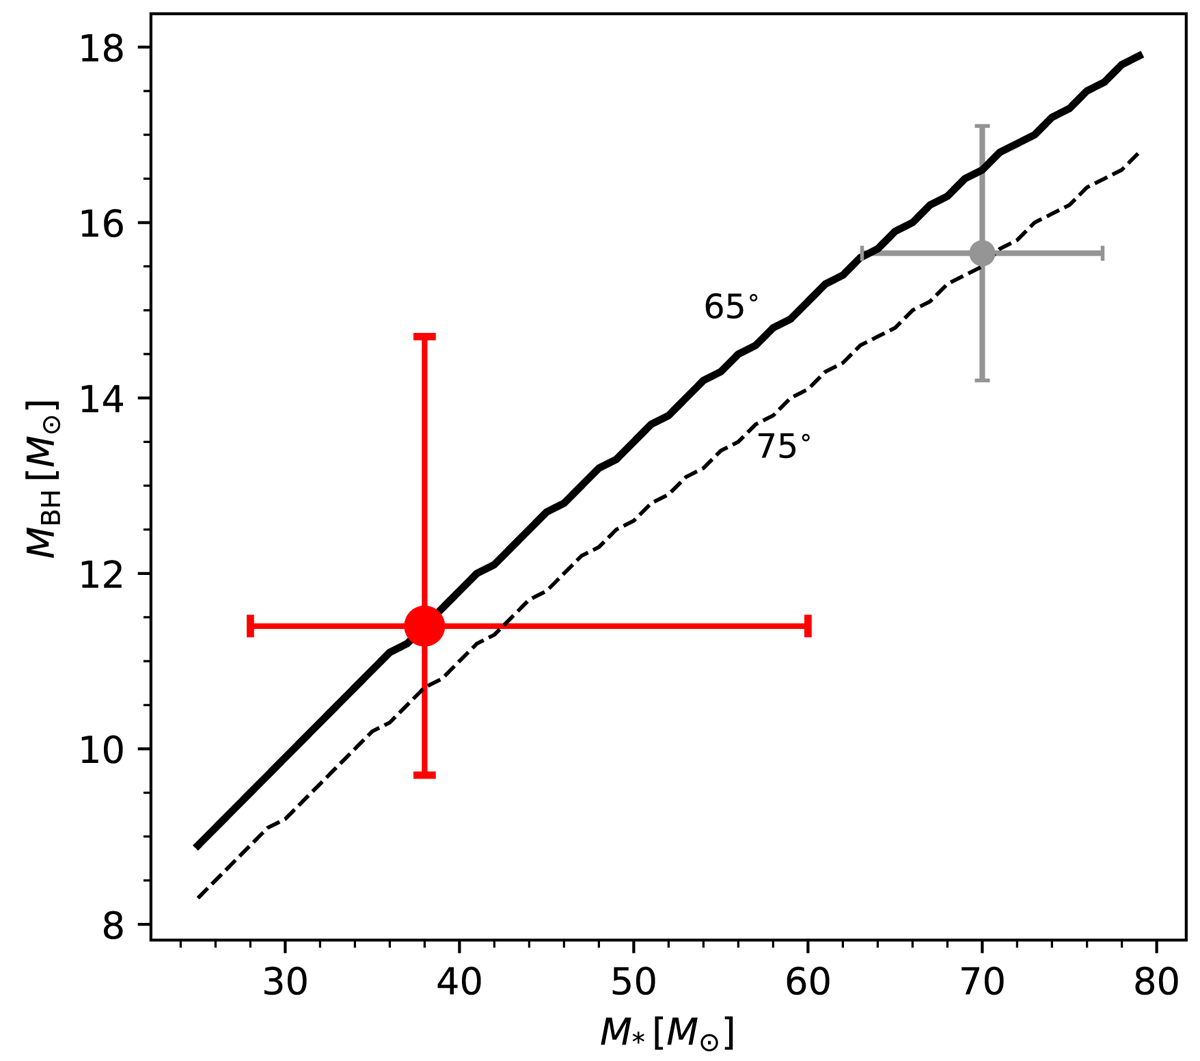
Fig. 8.
Download original image
Mass plane diagram for components in the M33 X-7. Masses derived in this work are marked in red whereas gray points represent previously determined values from Orosz et al. (2007). The uncertainty in masses is shown as error bars. The solid lines represent loci of constant orbital inclination angle of 65° derived in this work. The dashed line corresponds to the inclination angle of 75° derived by Orosz et al. (2007).
Current usage metrics show cumulative count of Article Views (full-text article views including HTML views, PDF and ePub downloads, according to the available data) and Abstracts Views on Vision4Press platform.
Data correspond to usage on the plateform after 2015. The current usage metrics is available 48-96 hours after online publication and is updated daily on week days.
Initial download of the metrics may take a while.