Open Access
Fig. 20.
Download original image
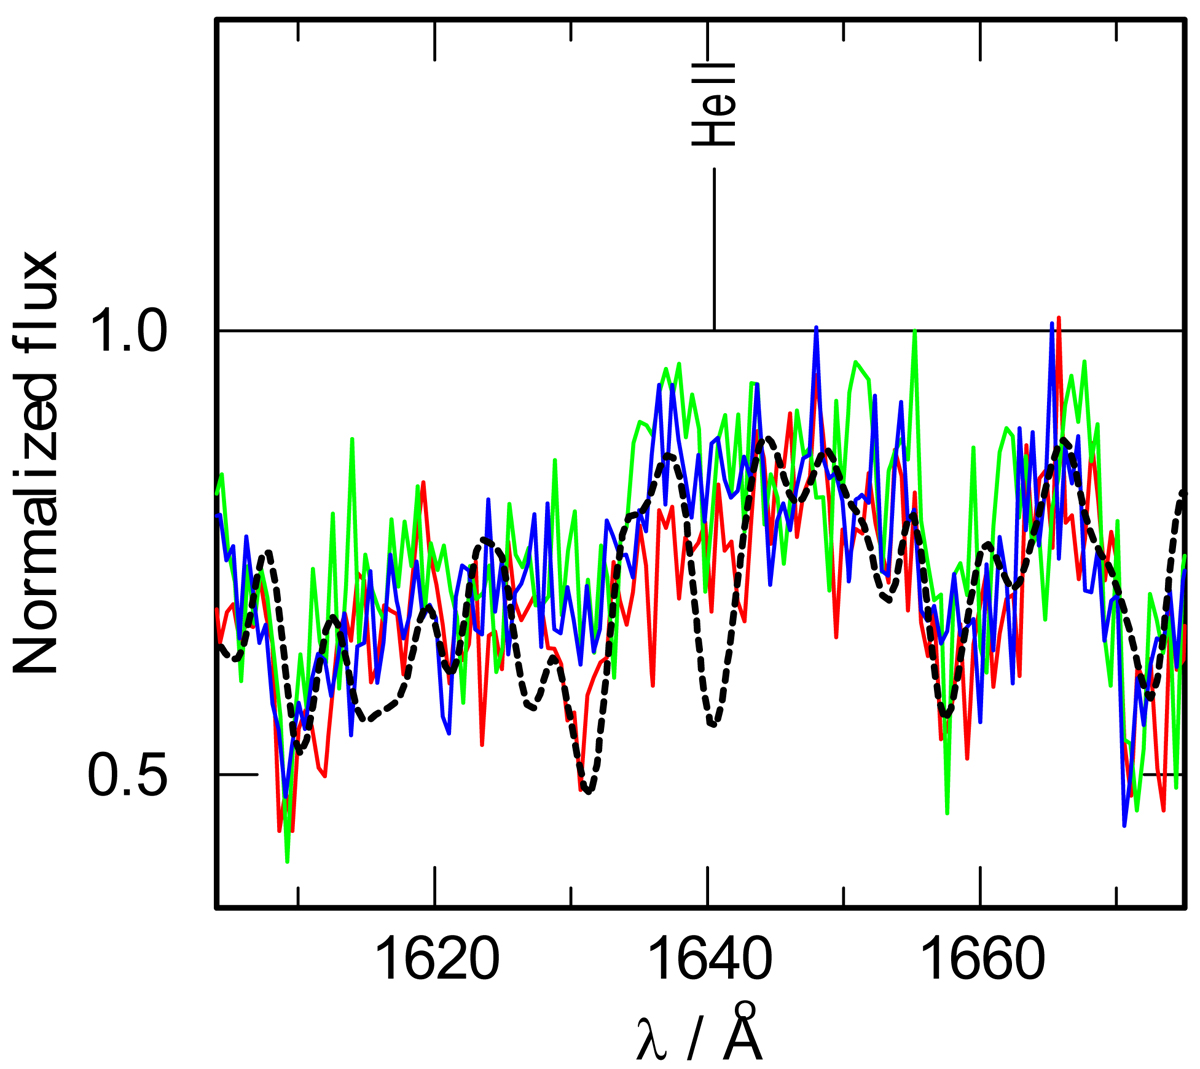
Comparison of UV spectra of M33-X7 around He II 1640 Å taken during different orbital phases. Line colors indicate different orbital phases as given in Fig. 9. The dashed black line represent our best fit model including Lx = 1038 erg s−1, corresponding to ϕ = 0.53.
Current usage metrics show cumulative count of Article Views (full-text article views including HTML views, PDF and ePub downloads, according to the available data) and Abstracts Views on Vision4Press platform.
Data correspond to usage on the plateform after 2015. The current usage metrics is available 48-96 hours after online publication and is updated daily on week days.
Initial download of the metrics may take a while.