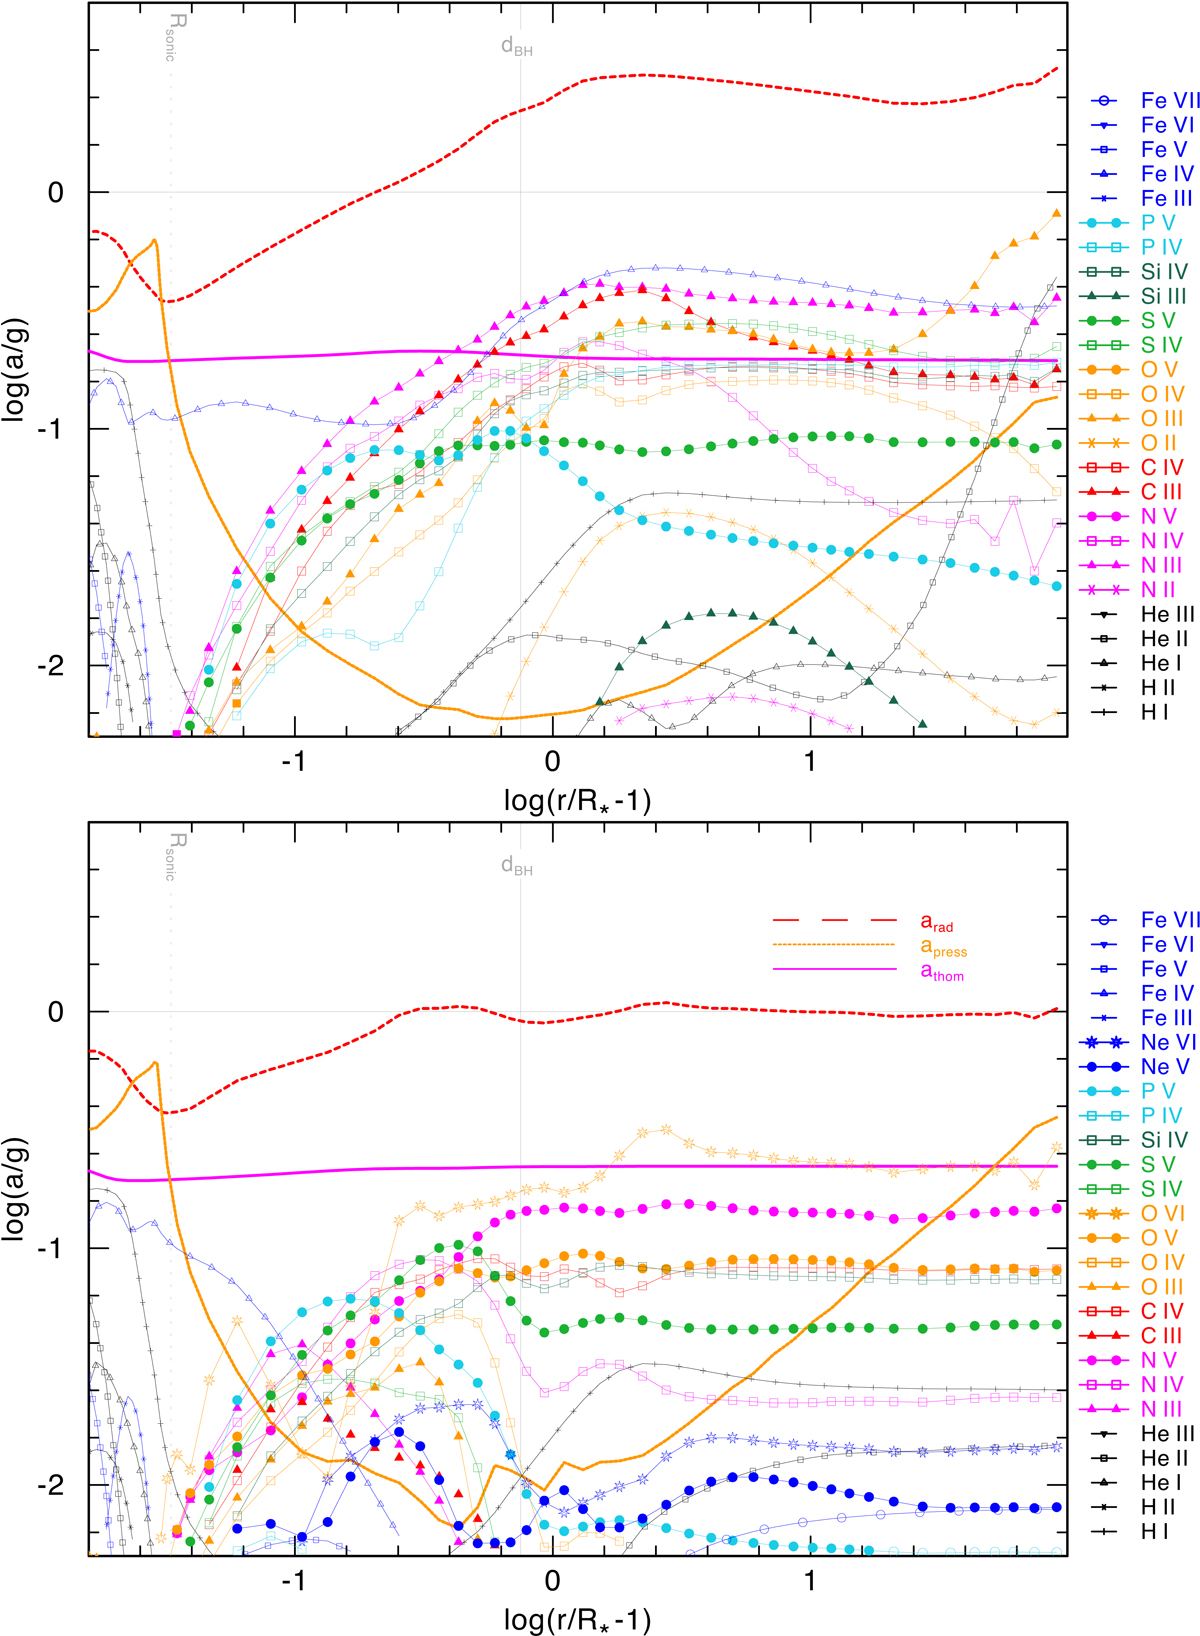
Fig. 14.
Download original image
Contributions to the radiative acceleration from the different ions for models with no X-ray (top) and including Lx ∼ 1036 erg s−1 (bottom). Symbols and colors representing different elements and their ionization state is shown in the figure. The plot is limited to the ions that contribute at least ∼1% to the radiative acceleration. Line acceleration due to scattering by free electrons (magenta solid curve) and gas pressure (orange dashed curve) and total radiative acceleration (red dashed curve) are plotted for comparison. The radius at which the BH is located is marked by a gray solid line and the location of the sonic point marked by gray dotted line.
Current usage metrics show cumulative count of Article Views (full-text article views including HTML views, PDF and ePub downloads, according to the available data) and Abstracts Views on Vision4Press platform.
Data correspond to usage on the plateform after 2015. The current usage metrics is available 48-96 hours after online publication and is updated daily on week days.
Initial download of the metrics may take a while.