Fig. 5
Download original image
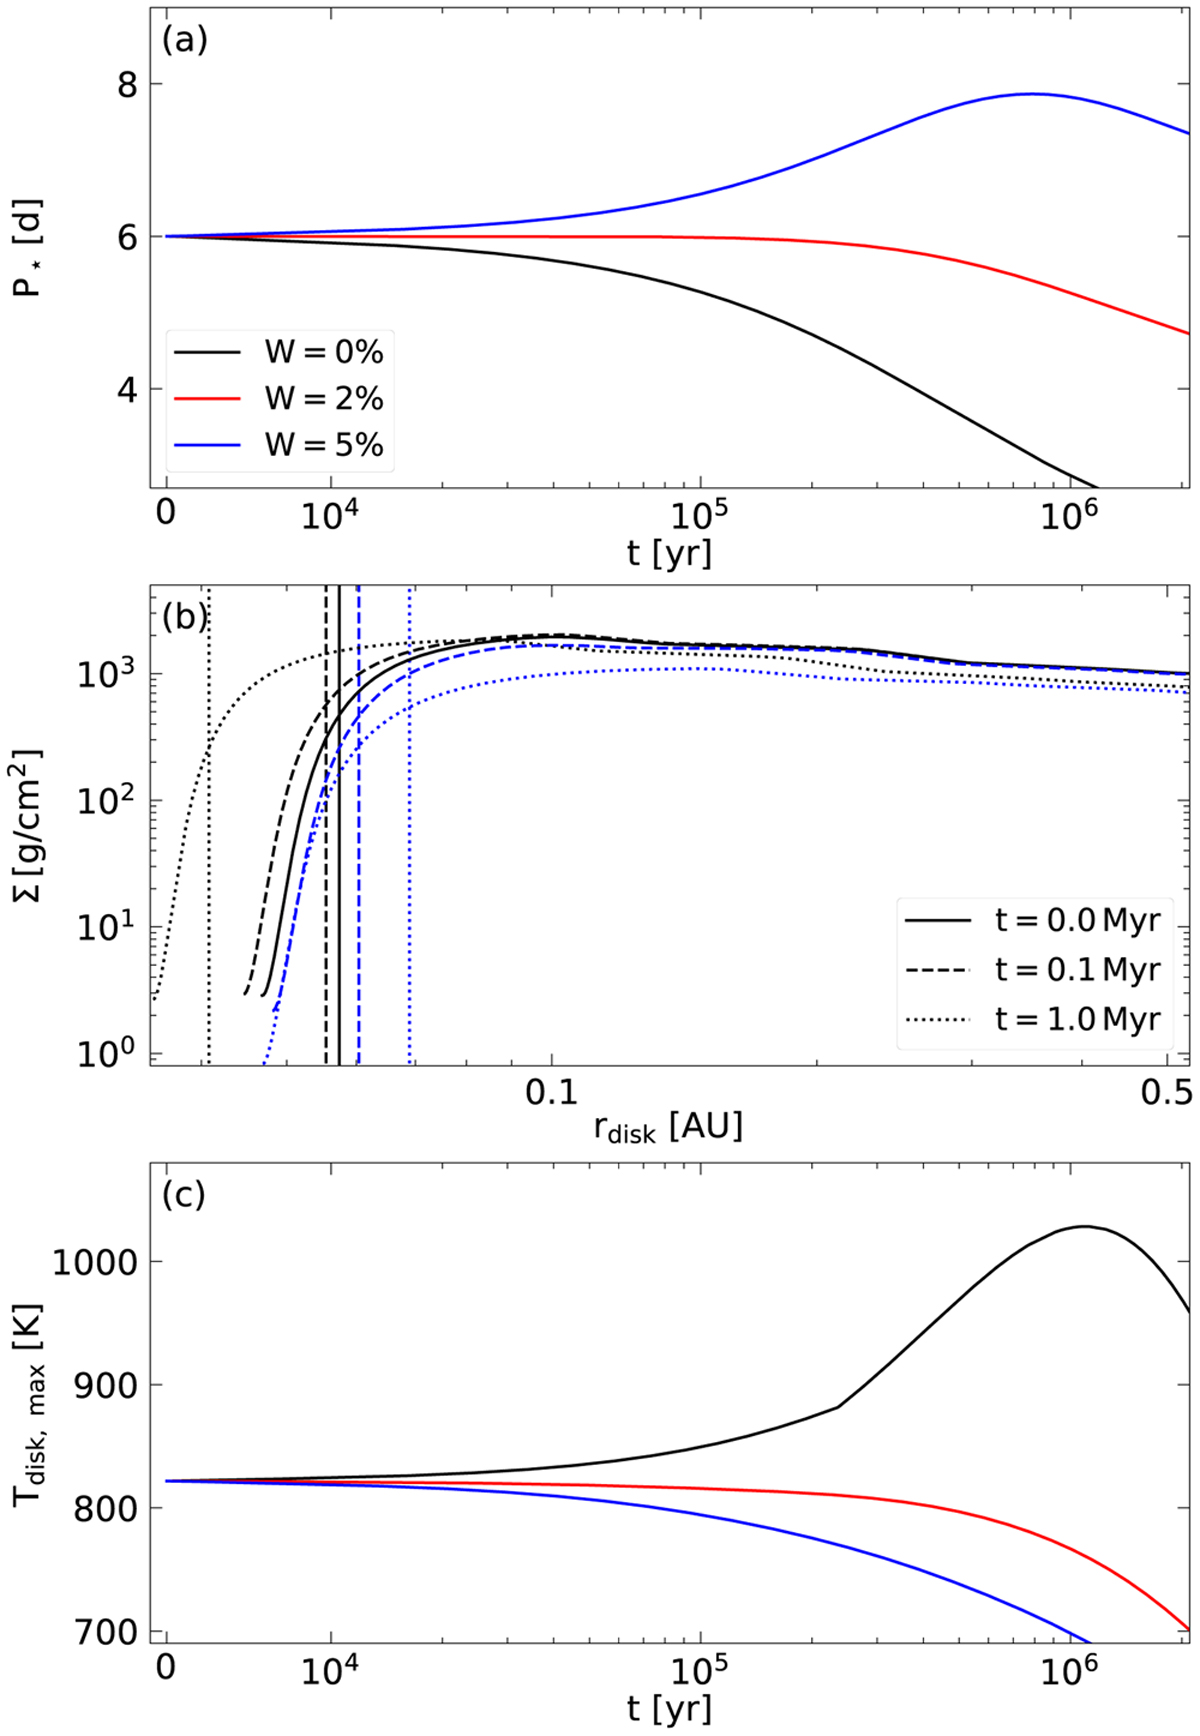
Panel a shows the evolution of the stellar rotational period P* with respect to the simulation time t in years starting from t0 = 1 Myr. The reference model Mref with W = 2%, the models with W = 0%, and W = 5% are given by the red, black and blue lines, respectively. Panel b shows the surface density of the innermost disk part (0.5 AU) for the models with W = 0% (black lines) and W = 5% (blue lines) at three different time snapshots: The initial model at t = 0.0 Myr (solid line), t = 0.1 Myr (dashed lines) and t = 1.0 Myr (dotted lines). The vertical lines represent the position of the co-rotation radius for the given APSW efficiency value and time snapshot. Note that the black and blue solid line are identical as the same initial model (t = 0.0 Myr) is used for this comparison. Panel c shows the evolution of the maximum disk temperature Tdisk,max at the disk’s midplane with respect to the simulation time t in years starting from t0 = 1 Myr. The line colors represent the same models as in panel a.
Current usage metrics show cumulative count of Article Views (full-text article views including HTML views, PDF and ePub downloads, according to the available data) and Abstracts Views on Vision4Press platform.
Data correspond to usage on the plateform after 2015. The current usage metrics is available 48-96 hours after online publication and is updated daily on week days.
Initial download of the metrics may take a while.