Fig. 4
Download original image
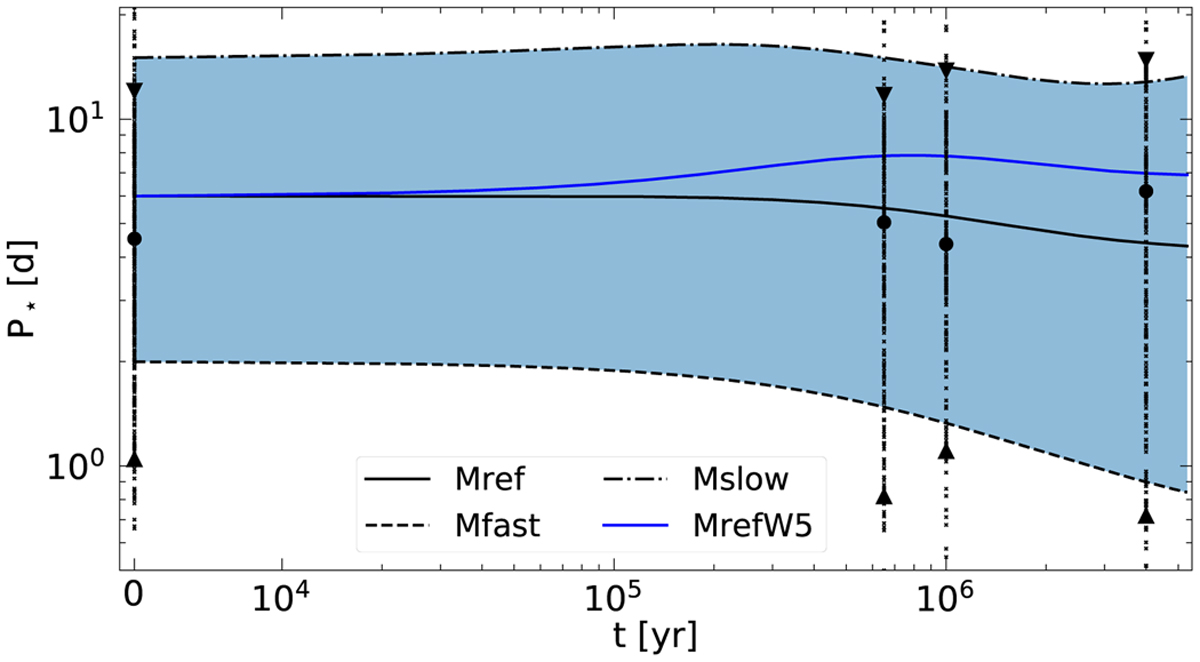
Evolution of the stellar rotational period P* with respect to the simulation time t in years starting from t0 = 1 Myr for the models Mref (solid line), Mfast (dashed line) and Mslow (dash-dotted line). Model MrefW5 (solid blue line) highlights the dependence on B* and the APSW value W (see text). The area between Mfast and Mslow is colored for better visualization. The observational data from four young stellar clusters are shown as “crosses” with the 50th percentile (big circle) and the 95th (5th) percentile (downward and upward pointing triangles). From left to right the open clusters are: ONC (Herbst et al. 2002), NGC 6530 (Henderson & Stassun 2012), NGC 2264 (Affer et al. 2013) and NGC 2362 (Irwin et al. 2008).
Current usage metrics show cumulative count of Article Views (full-text article views including HTML views, PDF and ePub downloads, according to the available data) and Abstracts Views on Vision4Press platform.
Data correspond to usage on the plateform after 2015. The current usage metrics is available 48-96 hours after online publication and is updated daily on week days.
Initial download of the metrics may take a while.