Fig. 2
Download original image
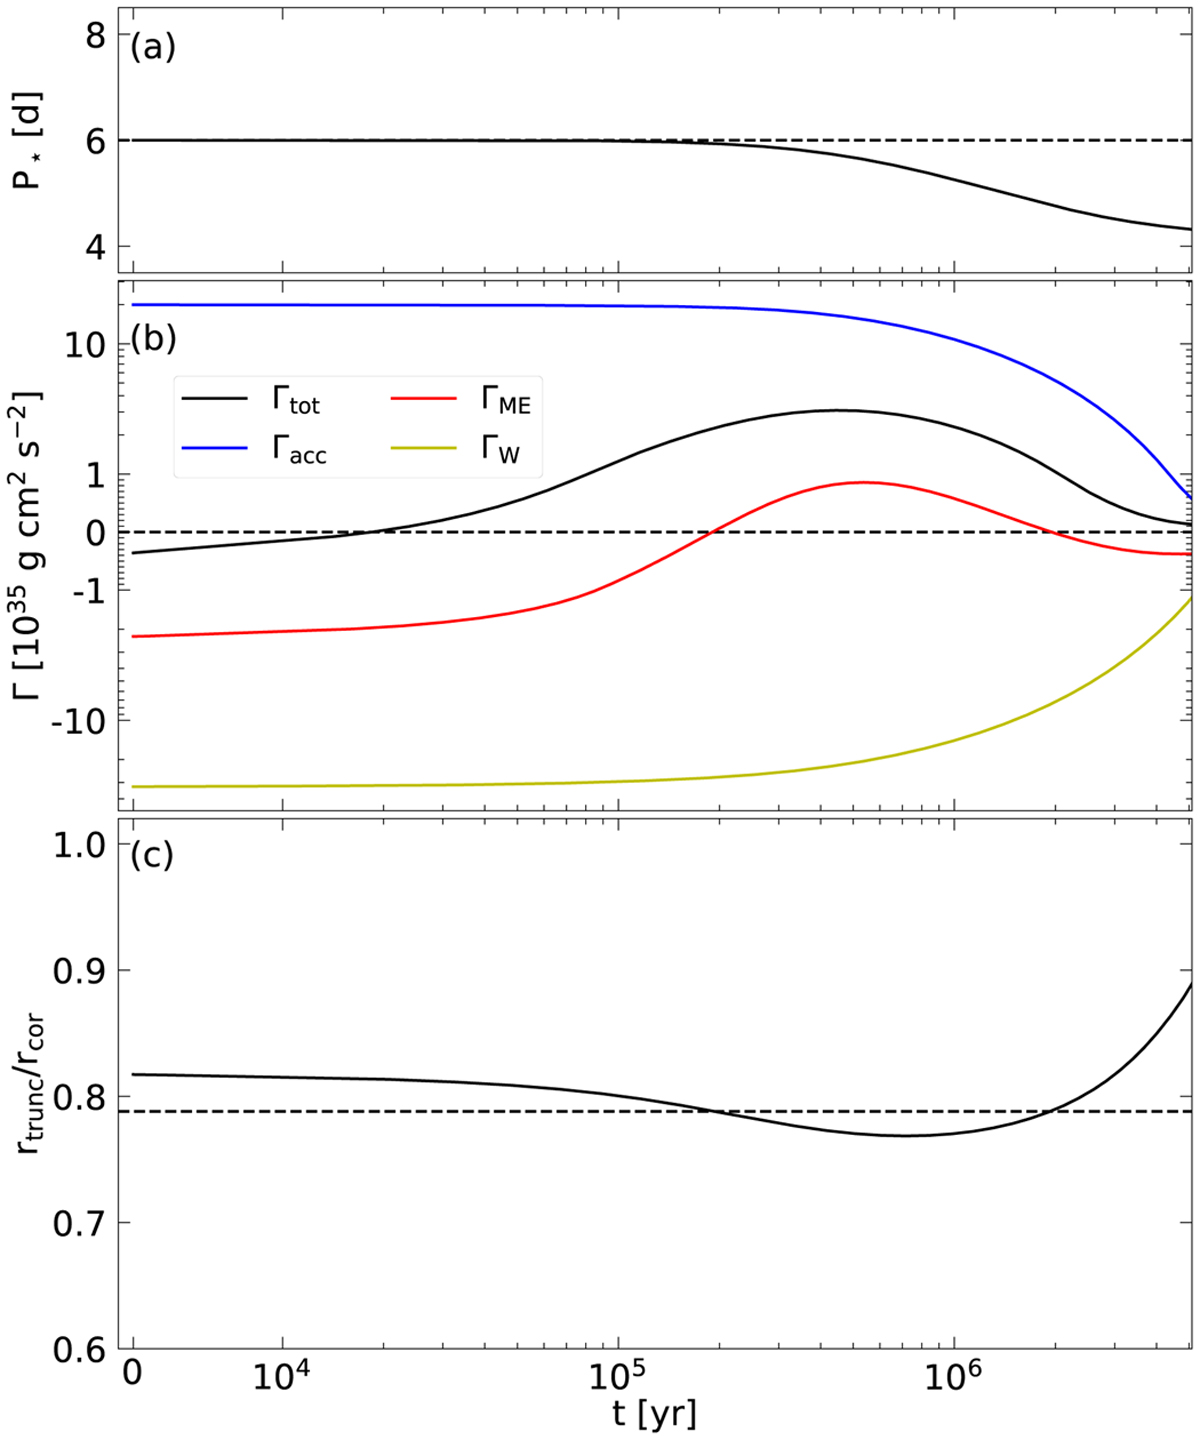
Stellar spin evolution for Mref with respect to the simulation time t in years starting from t0 = 1 Myr. Panel a shows the stellar rotation period P* in days. The dashed black line indicates the initial period of 6 days. Panel b shows the external torque contributions (see Sect. 2.4) as well as the total torque acting on the star (black line). The blue, red and yellow line represent the accretion torque Γacc, torque due to MEs ΓME and the APSW torque Γw, respectively. The dashed line at Γ = 0.0 indicate the boundary between a spin up and a spin down contribution. Panel c shows the position of the inner disk radius rtrunc with respect to the position of the co-rotation radius rcor The dashed line indicate ![]() .
.
Current usage metrics show cumulative count of Article Views (full-text article views including HTML views, PDF and ePub downloads, according to the available data) and Abstracts Views on Vision4Press platform.
Data correspond to usage on the plateform after 2015. The current usage metrics is available 48-96 hours after online publication and is updated daily on week days.
Initial download of the metrics may take a while.