Fig. 1
Download original image
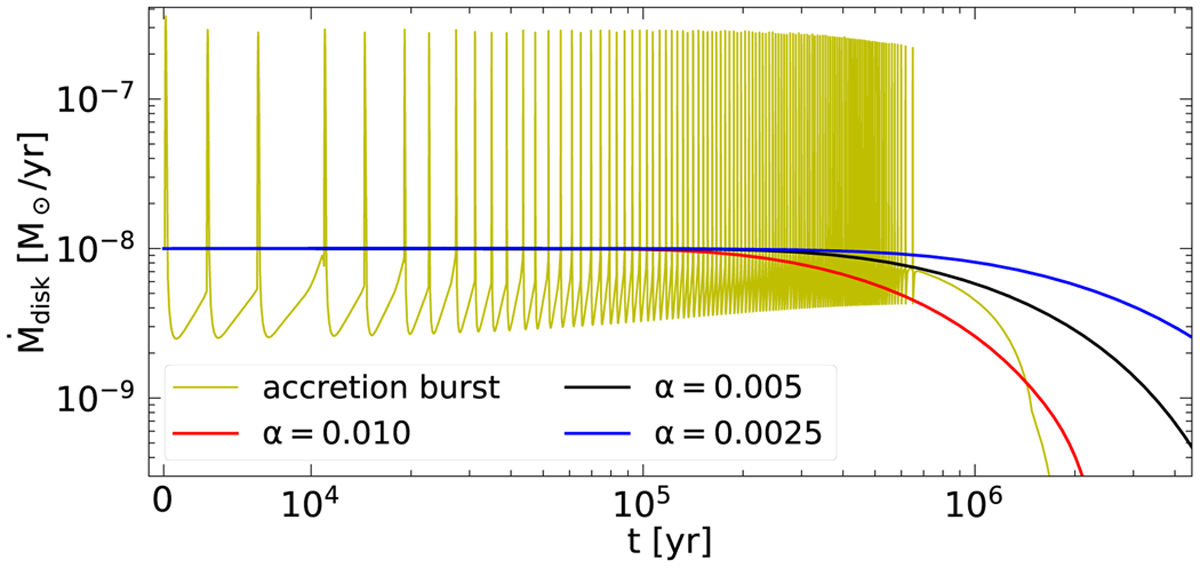
Disk accretion rate Ṁdisk with respect to the simulation time t in years starting from t0 = 1 Myr. The red, black, blue lines correspond to a constant α value of 0.01, 0.005 and 0.0025, respectively. The yellow line corresponds to a layered disk model (Gammie 1996) with αMRI = 0.02 and αDZ = 0.0004 (similar to Steiner et al. 2021).
Current usage metrics show cumulative count of Article Views (full-text article views including HTML views, PDF and ePub downloads, according to the available data) and Abstracts Views on Vision4Press platform.
Data correspond to usage on the plateform after 2015. The current usage metrics is available 48-96 hours after online publication and is updated daily on week days.
Initial download of the metrics may take a while.