Fig. 7
Download original image
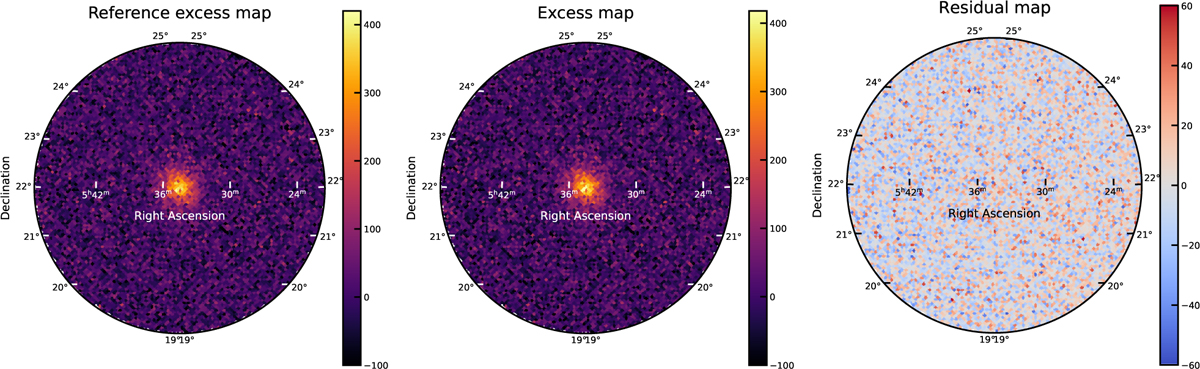
Comparison of excess counts maps of the Crab nebula region. Left: crab excess counts map above 1 TeV as computed from the standard HAWC pipeline. Middle: Crab excess counts map above 1 TeV as computed from the DL3 data products. Right: residual map resulting from subtracting the reference map from the map derived from the DL3 data products.
Current usage metrics show cumulative count of Article Views (full-text article views including HTML views, PDF and ePub downloads, according to the available data) and Abstracts Views on Vision4Press platform.
Data correspond to usage on the plateform after 2015. The current usage metrics is available 48-96 hours after online publication and is updated daily on week days.
Initial download of the metrics may take a while.