Open Access
Fig. 6
Download original image
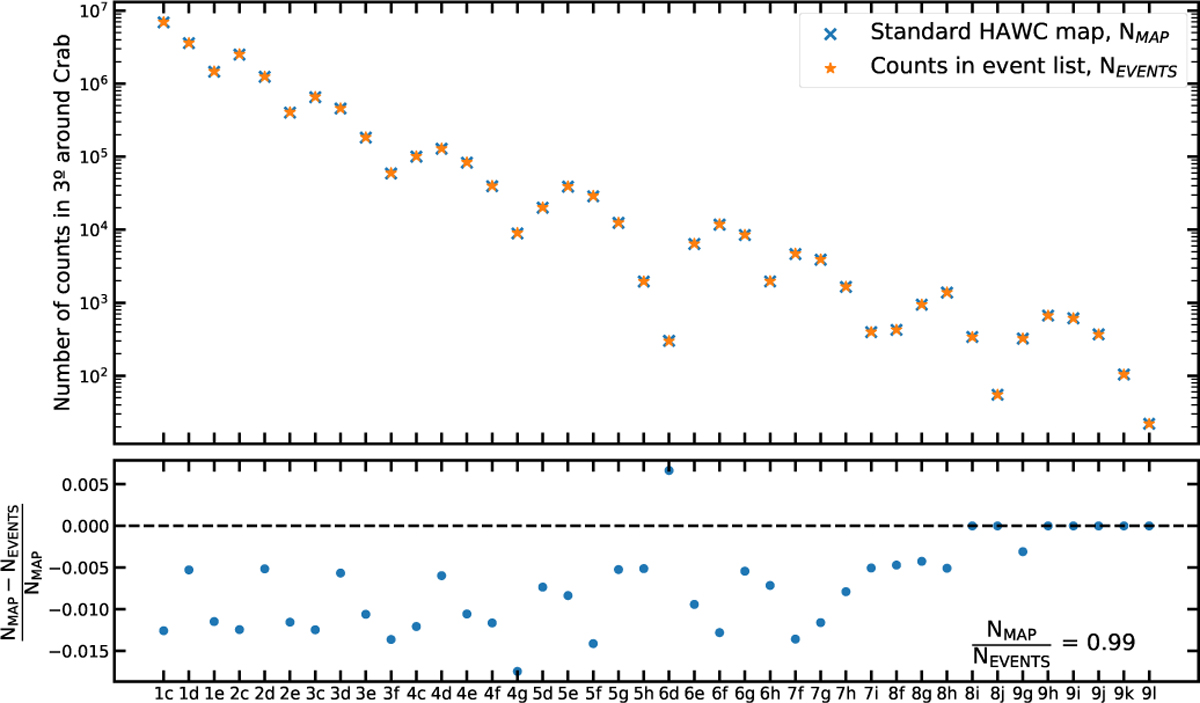
Comparison of the number of events in a region of 3° radius around the Crab nebula in the standard HAWC map and in the event lists for each of the analysis bins. The selected 2D bins shown here are those that are used in Sect. 7.1 and follow the selection procedure described in Abeysekara et al. (2019).
Current usage metrics show cumulative count of Article Views (full-text article views including HTML views, PDF and ePub downloads, according to the available data) and Abstracts Views on Vision4Press platform.
Data correspond to usage on the plateform after 2015. The current usage metrics is available 48-96 hours after online publication and is updated daily on week days.
Initial download of the metrics may take a while.