Open Access
Fig. 10
Download original image
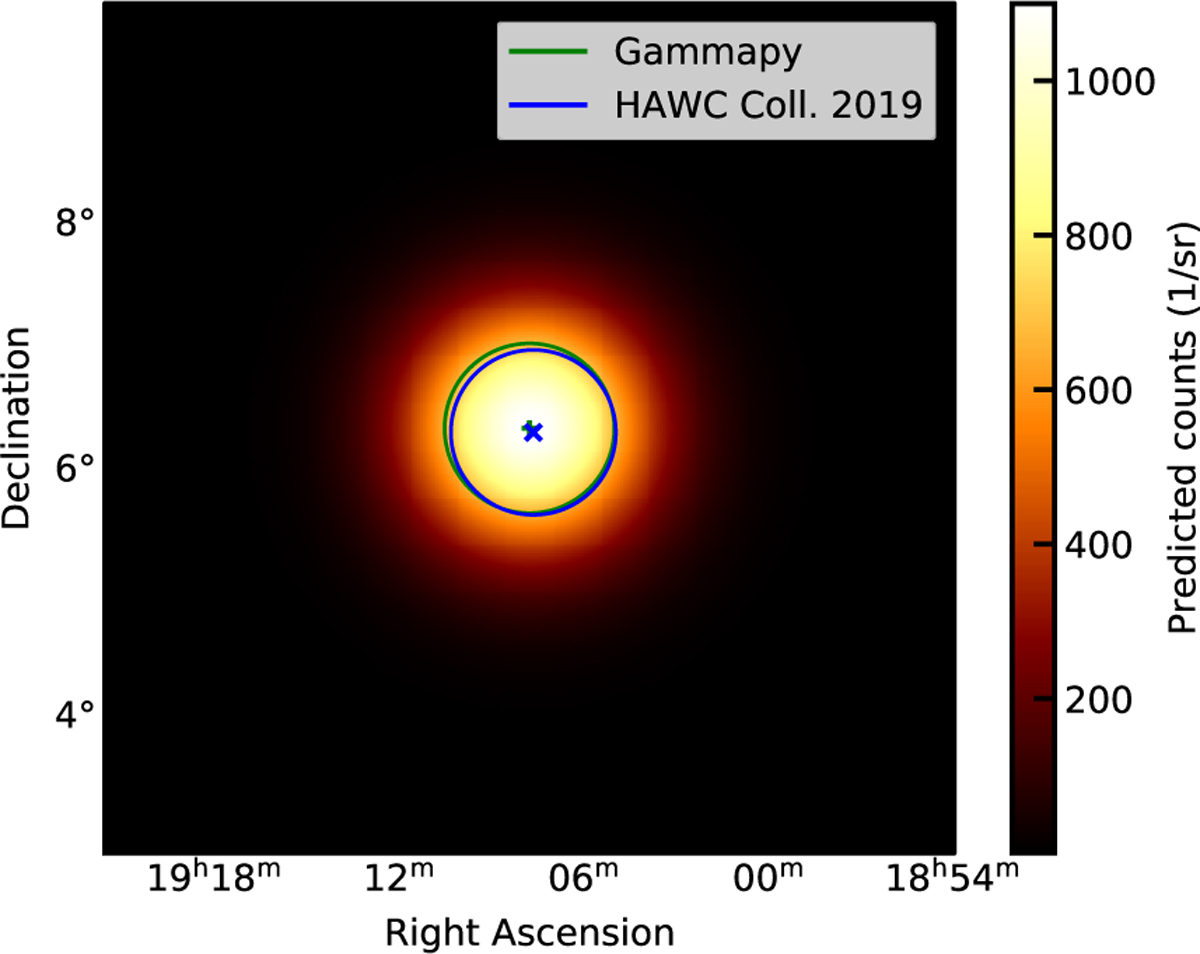
Spatial model of eHWC J1907+063 as obtained with Gammapy. The green star and circle represent the best-fit position and the 68% containment region, respectively. The blue cross and circle are the reference values from Abeysekara et al. (2020) for each quantity.
Current usage metrics show cumulative count of Article Views (full-text article views including HTML views, PDF and ePub downloads, according to the available data) and Abstracts Views on Vision4Press platform.
Data correspond to usage on the plateform after 2015. The current usage metrics is available 48-96 hours after online publication and is updated daily on week days.
Initial download of the metrics may take a while.