Fig. 8
Download original image
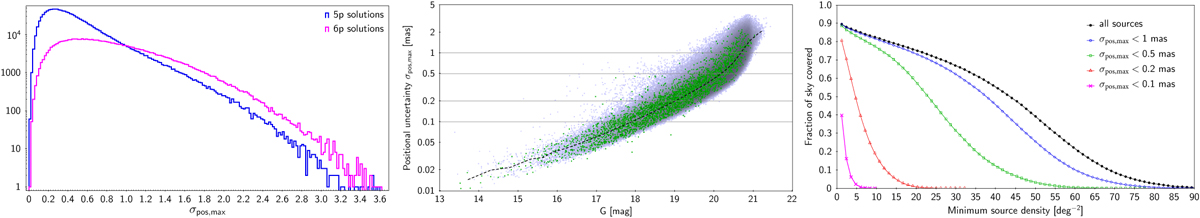
Positional uncertainty and source density distribution in Gaia-CRF3. Left: histogram of the positional uncertainty σpos,max for Gaia-CRF3 sources with five-parameter solutions (blue) and six-parameter solutions (magenta). Middle: scatter plot of σpos,max versus the G magnitude. The dashed curve is the smoothed median uncertainty versus magnitude. The green points are the sources matched to ICRF3 S/X. Right: fraction of sky covered by a given minimum density of Gaia-CRF3 sources at different levels of positional uncertainty (see text for further explanation).
Current usage metrics show cumulative count of Article Views (full-text article views including HTML views, PDF and ePub downloads, according to the available data) and Abstracts Views on Vision4Press platform.
Data correspond to usage on the plateform after 2015. The current usage metrics is available 48-96 hours after online publication and is updated daily on week days.
Initial download of the metrics may take a while.