Fig. 12
Download original image
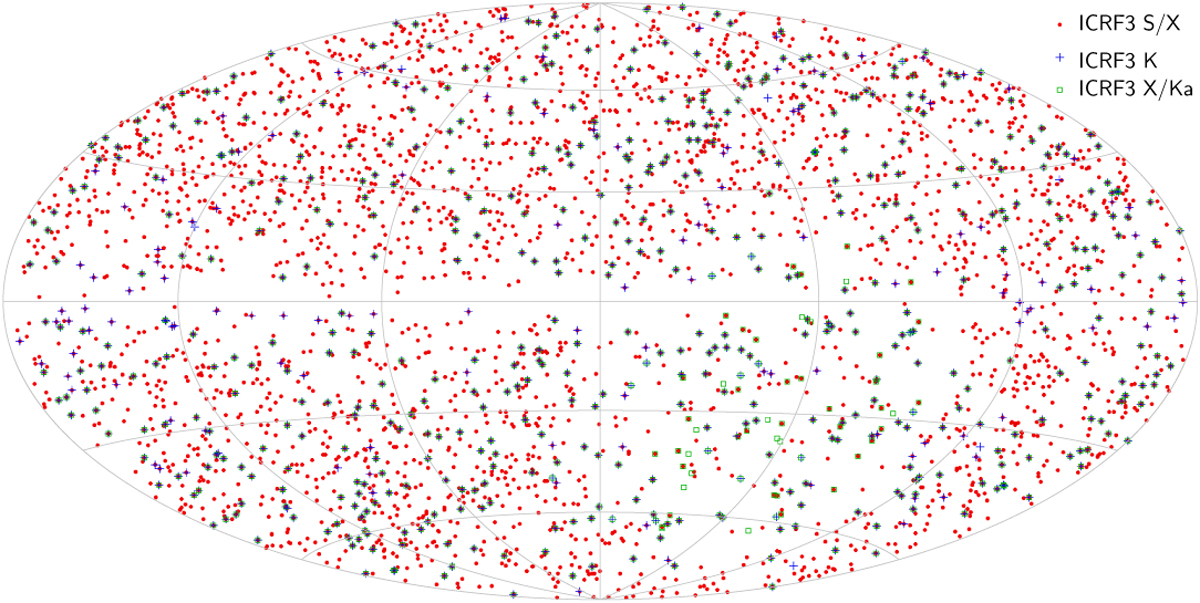
Distribution of the ICRF3 sources in Gaia-CRF3 in Galactic coordinates. Sources from ICRF3 S/X are shown by red dots, from ICRF3 K by blue crosses, and from ICRF3 X/Ka by turquoise squares. This map uses a Hammer–Aitoff projection in galactic coordinates, with l = b = 0 at the centre, north up, and l increasing from right to left.
Current usage metrics show cumulative count of Article Views (full-text article views including HTML views, PDF and ePub downloads, according to the available data) and Abstracts Views on Vision4Press platform.
Data correspond to usage on the plateform after 2015. The current usage metrics is available 48-96 hours after online publication and is updated daily on week days.
Initial download of the metrics may take a while.