Open Access
Fig. 9
Download original image
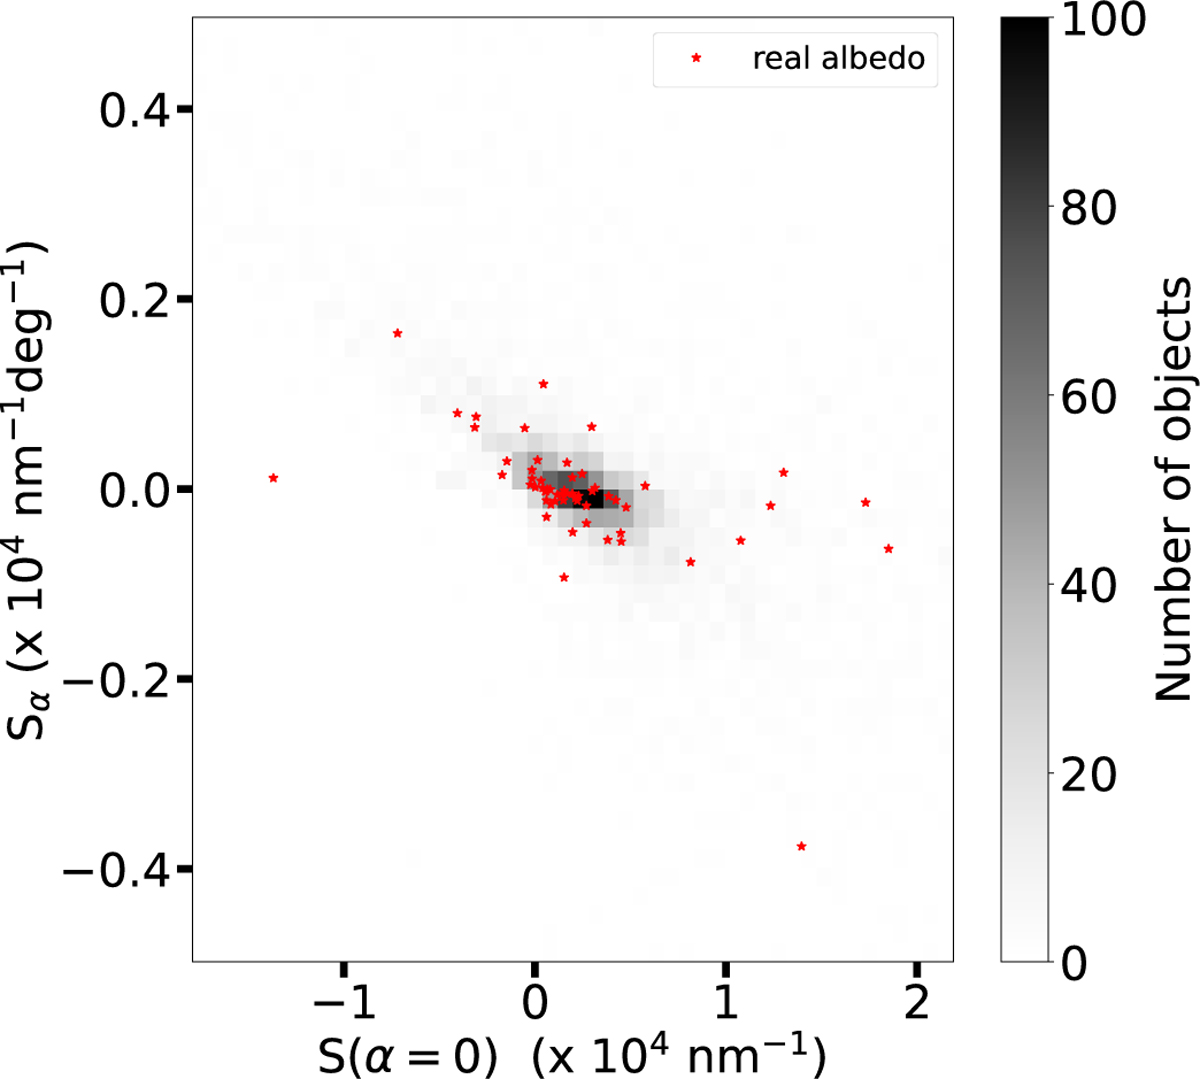
Spectral slope at α = 0 deg versus rate of change of spectral slope with α. Red asterisks show objects with measured pAKARI while the 2D histogram shows the complete dataset with random values of albedo. We do not show the error bars for clarity.
Current usage metrics show cumulative count of Article Views (full-text article views including HTML views, PDF and ePub downloads, according to the available data) and Abstracts Views on Vision4Press platform.
Data correspond to usage on the plateform after 2015. The current usage metrics is available 48-96 hours after online publication and is updated daily on week days.
Initial download of the metrics may take a while.