Fig. 8
Download original image
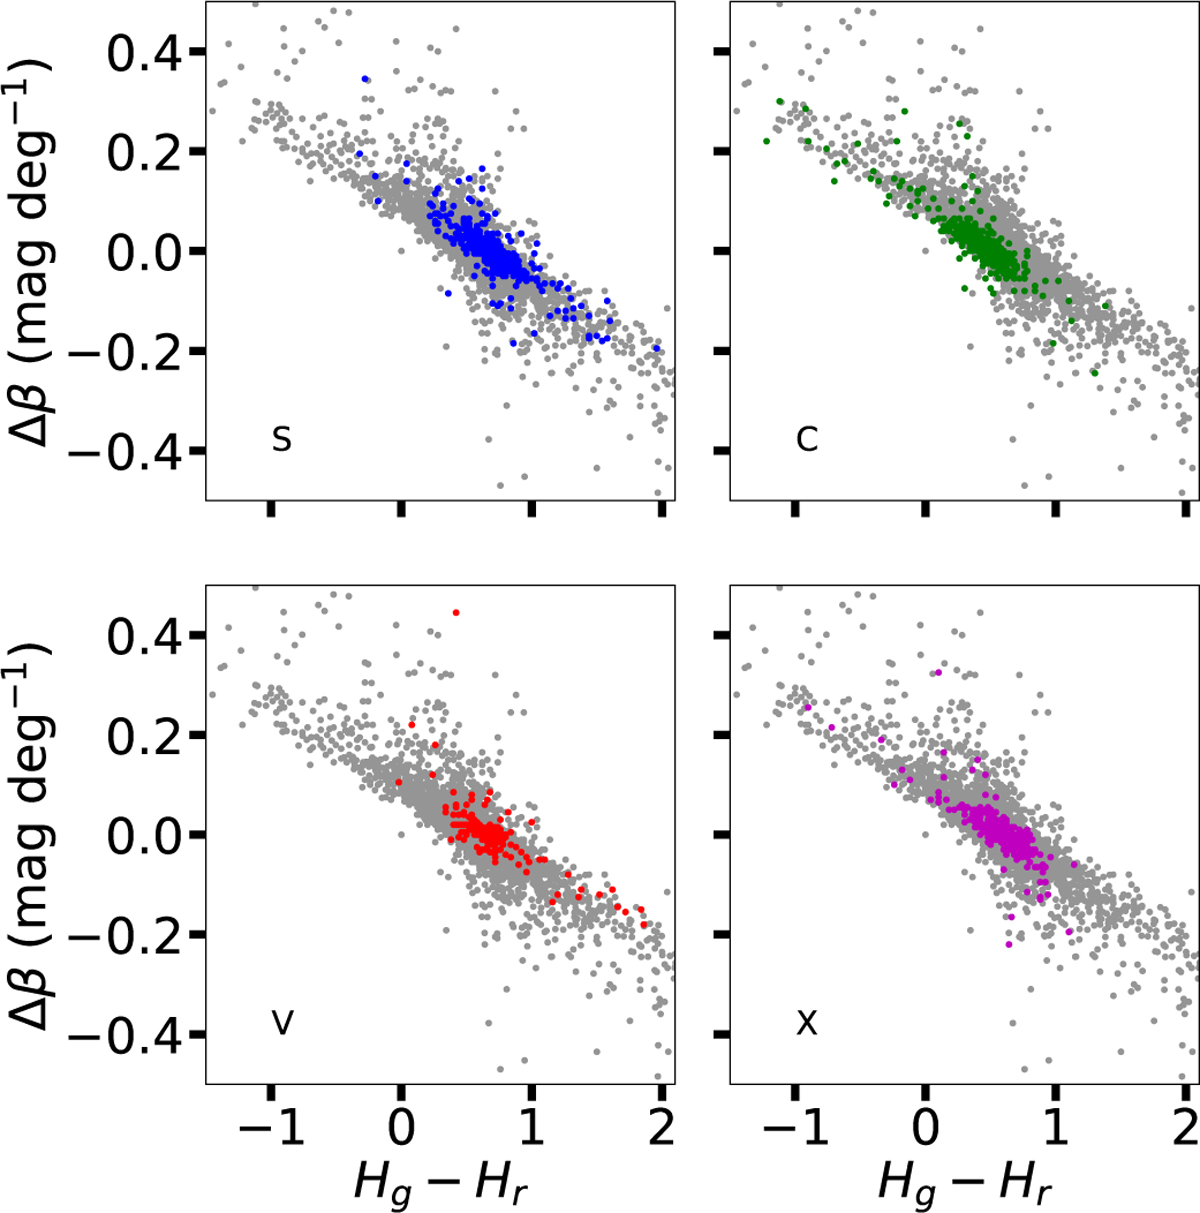
Hg − Hr versus Δβ. In all panels, the complete sample is shown as gray dots, while different colors mark the different complexes: S-complex in blue (upper left panel), C-complex in green (upper right panel), V-complex in red (bottom left panel), and X-complex in purple (bottom right panel). We do not show the error bars for clarity.
Current usage metrics show cumulative count of Article Views (full-text article views including HTML views, PDF and ePub downloads, according to the available data) and Abstracts Views on Vision4Press platform.
Data correspond to usage on the plateform after 2015. The current usage metrics is available 48-96 hours after online publication and is updated daily on week days.
Initial download of the metrics may take a while.