Fig. 3
Download original image
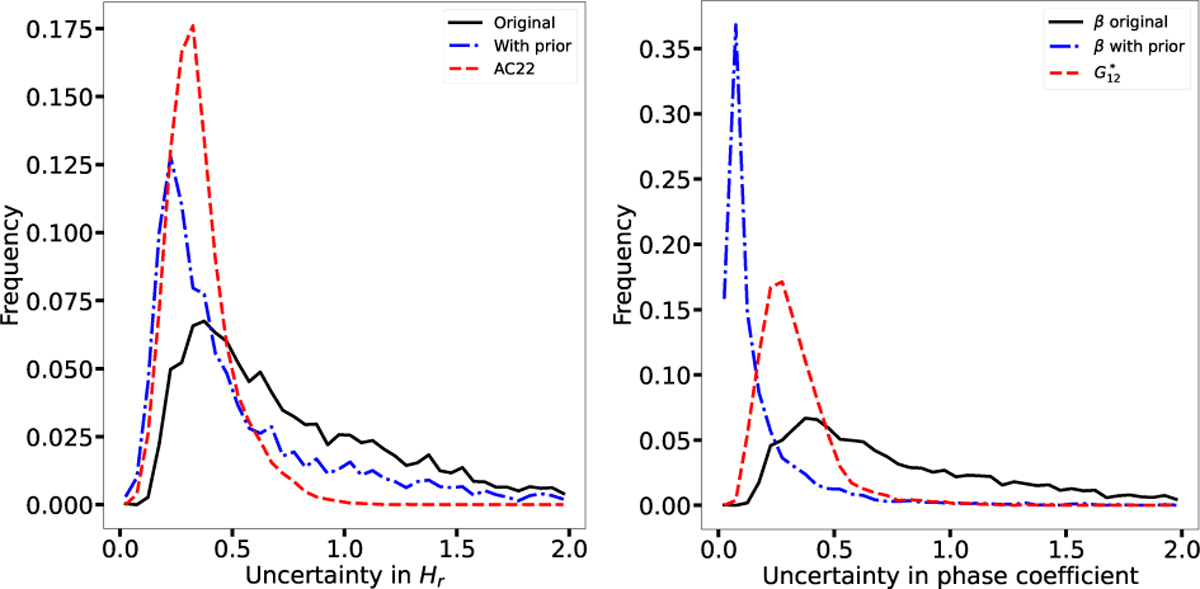
Distributions of uncertainties. The red dashed line indicates AC22. The continuous black line shows the uncertainties before applying the prior for AC22, and the blue dot-dashed line shows the final uncertainty distribution after applying the prior. The left panel shows the uncertainties in Hr, while the right panel shows them for the phase coefficient. We note that in the latter, the coefficients differ between AC22 and ours.
Current usage metrics show cumulative count of Article Views (full-text article views including HTML views, PDF and ePub downloads, according to the available data) and Abstracts Views on Vision4Press platform.
Data correspond to usage on the plateform after 2015. The current usage metrics is available 48-96 hours after online publication and is updated daily on week days.
Initial download of the metrics may take a while.