Open Access
Fig. A.2
Download original image
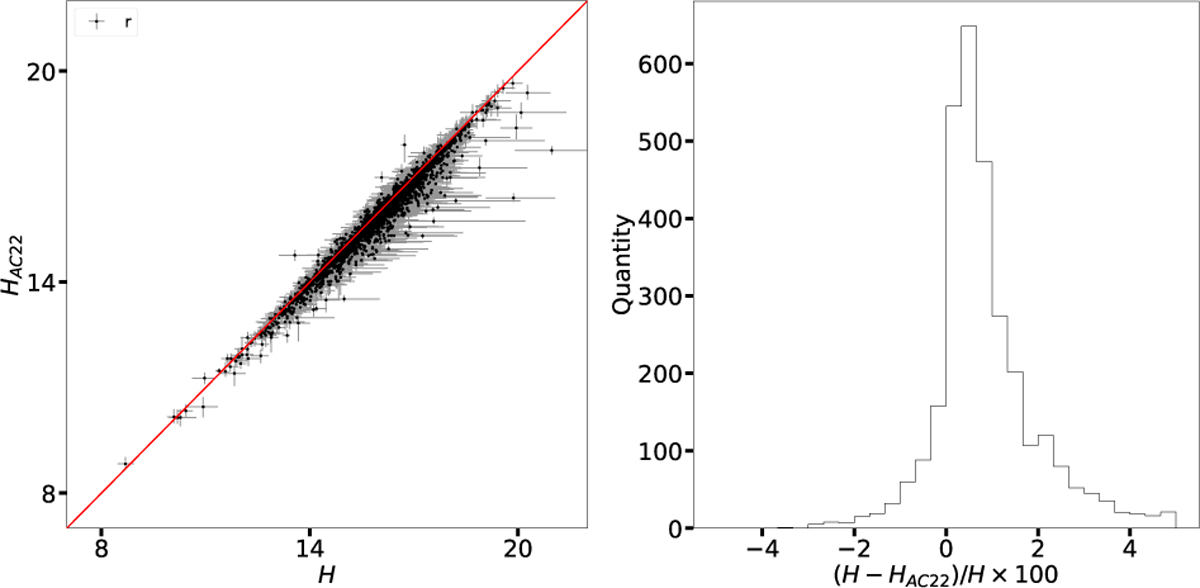
Comparison between linear and ![]() models. Left panel: Hr obtained by us using the linear model (labeled H) against the magnitude obtained in AC22. The red line indicates the 1 : 1 relation. Right panel: Distribution of the percentage change between the obtained H; we cut the x-axis for clarity.
models. Left panel: Hr obtained by us using the linear model (labeled H) against the magnitude obtained in AC22. The red line indicates the 1 : 1 relation. Right panel: Distribution of the percentage change between the obtained H; we cut the x-axis for clarity.
Current usage metrics show cumulative count of Article Views (full-text article views including HTML views, PDF and ePub downloads, according to the available data) and Abstracts Views on Vision4Press platform.
Data correspond to usage on the plateform after 2015. The current usage metrics is available 48-96 hours after online publication and is updated daily on week days.
Initial download of the metrics may take a while.