Open Access
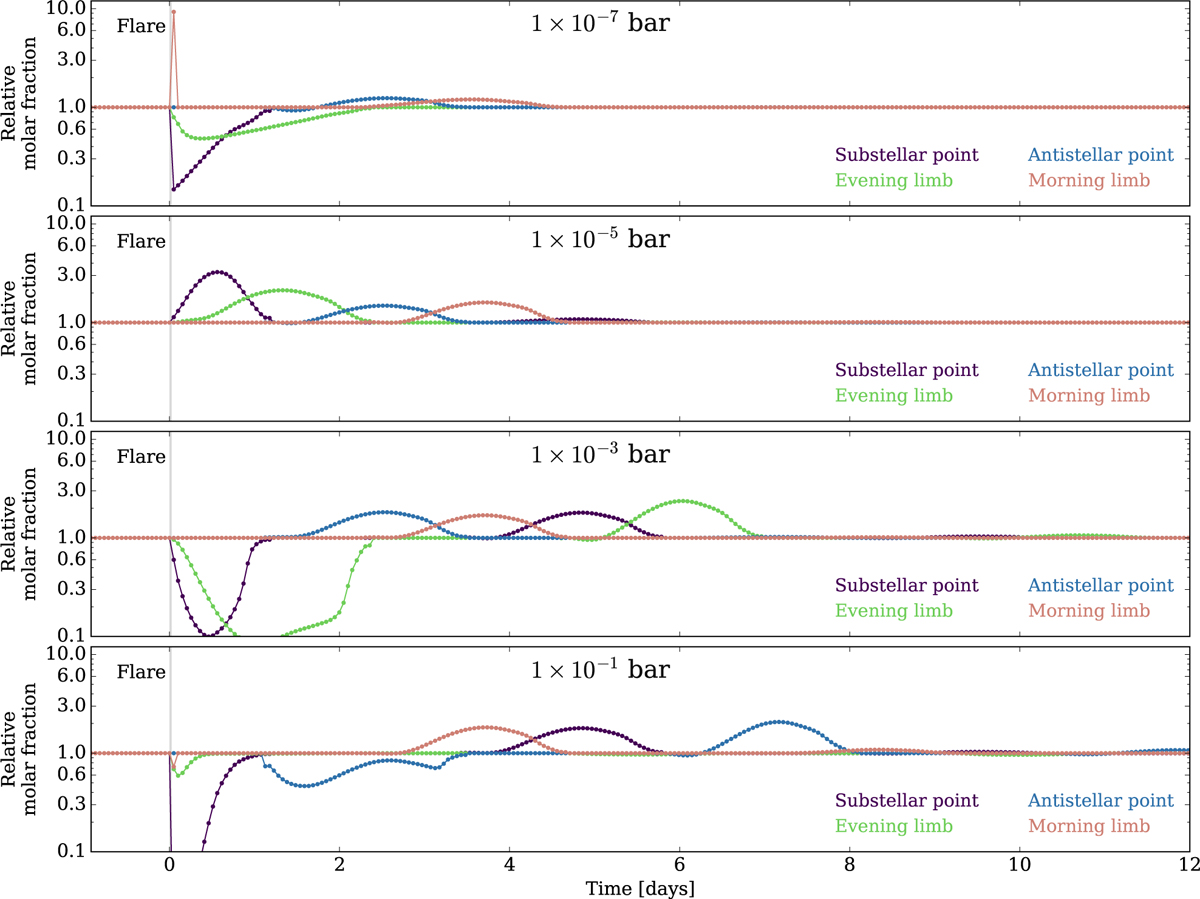
Fig. 5
Download original image
Evolution of C2H2 in the first ~2 weeks after the flare event at different pressures in the atmosphere on four longitudes. By plotting different longitudes, we trace the advection of atmospheric constituents by the horizontal wind in time.
Current usage metrics show cumulative count of Article Views (full-text article views including HTML views, PDF and ePub downloads, according to the available data) and Abstracts Views on Vision4Press platform.
Data correspond to usage on the plateform after 2015. The current usage metrics is available 48-96 hours after online publication and is updated daily on week days.
Initial download of the metrics may take a while.