Open Access
Fig. 16
Download original image
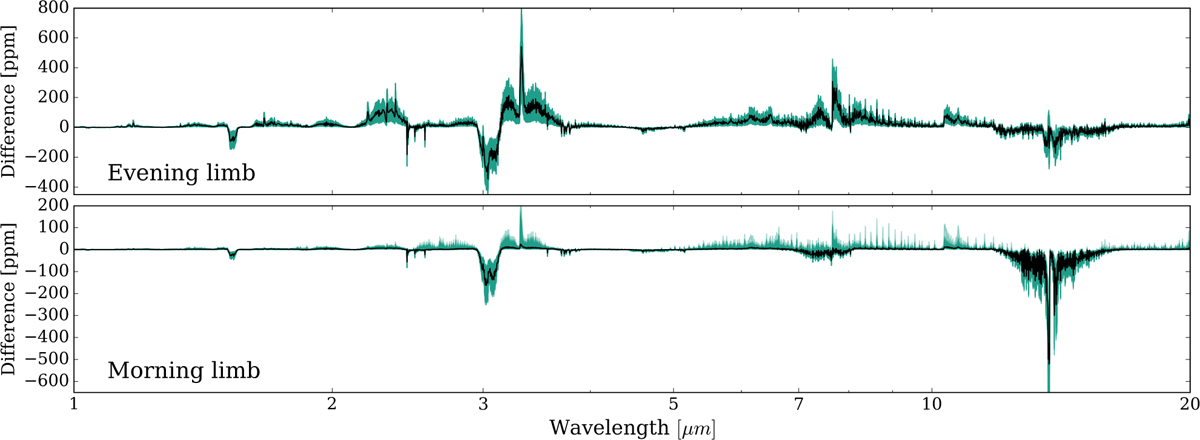
Differences in transmission spectra with respect to the pre-fiare state on every time-step during the ~two weeks of flaring according to a FFD, superimposed onto each other in green. The median value of the transit depth on every wavelength is indicated in black.
Current usage metrics show cumulative count of Article Views (full-text article views including HTML views, PDF and ePub downloads, according to the available data) and Abstracts Views on Vision4Press platform.
Data correspond to usage on the plateform after 2015. The current usage metrics is available 48-96 hours after online publication and is updated daily on week days.
Initial download of the metrics may take a while.