Fig. 11
Download original image
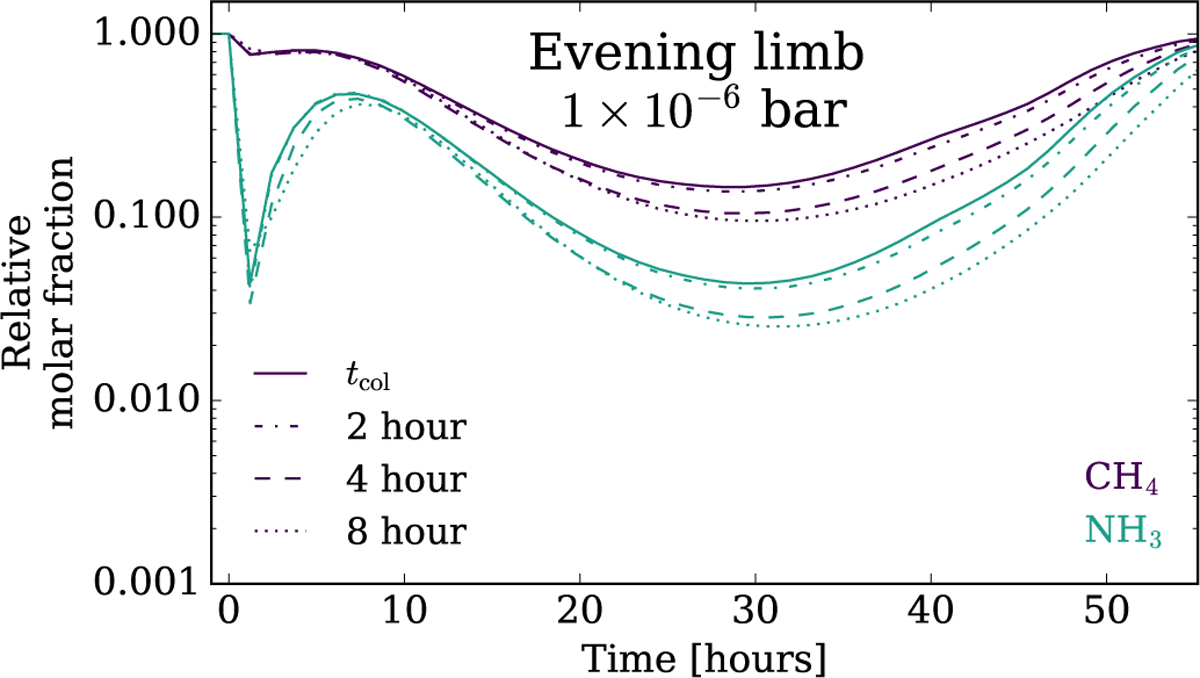
Evolution of CH4 and NH3 during the first ~2.3 days (PWind/2) after the start of the flare event in the upper atmosphere (1 μbar) of the evening limb. Three simulations are shown that correspond to 2 × 1033 erg flares of 2 (dashed-dotted), 4 (dashed) and 8 (dotted) hours. The simulation discussed in Sects. 4.1 and 4.2, with a flare of tcol without exponential decay, is shown by the solid line.
Current usage metrics show cumulative count of Article Views (full-text article views including HTML views, PDF and ePub downloads, according to the available data) and Abstracts Views on Vision4Press platform.
Data correspond to usage on the plateform after 2015. The current usage metrics is available 48-96 hours after online publication and is updated daily on week days.
Initial download of the metrics may take a while.