Fig. 10
Download original image
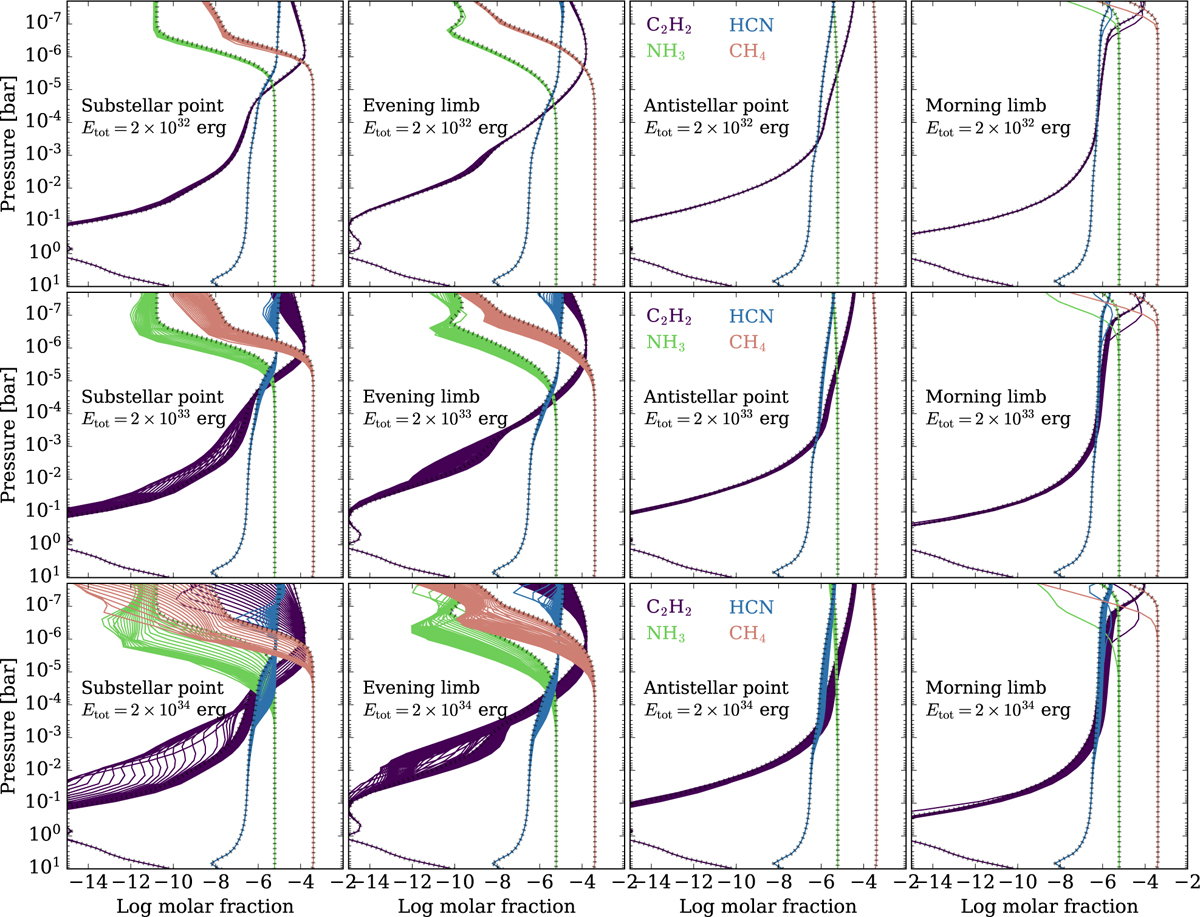
Distributions of CH4, NH3, C2H2, and HCN during and ~1 month after a flare event of total energy 2 × 1032 erg (upper row), 2 × 1033 erg (middle row) and 2 × 1034 erg (lower row). From left to right: substellar point, evening limb, antistellar point and morning limb. The pre-flare distributions are represented by the black dotted lines.
Current usage metrics show cumulative count of Article Views (full-text article views including HTML views, PDF and ePub downloads, according to the available data) and Abstracts Views on Vision4Press platform.
Data correspond to usage on the plateform after 2015. The current usage metrics is available 48-96 hours after online publication and is updated daily on week days.
Initial download of the metrics may take a while.