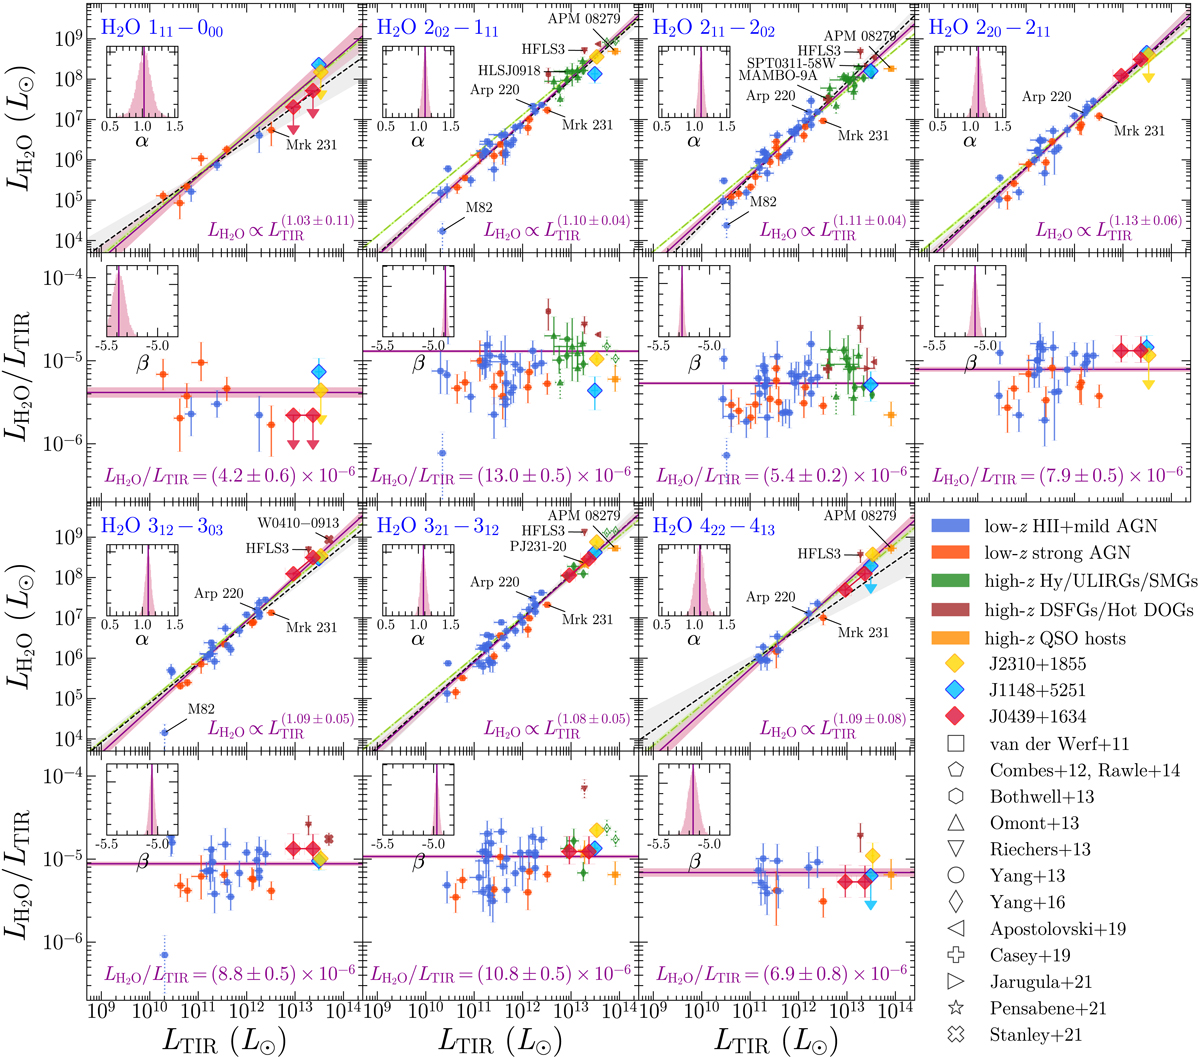
Fig. 9.
Download original image
Correlations between H2O line luminosities and total IR luminosities. The reference transition is reported in the upper left corner in the upper panels. Lower panels: report the correspondent LH2O/LTIR as a function of LTIR. Data points show measurements of local and high-z Hy/ULIRGs, SMGs, DSFGs/Hot DOGs, and QSO hosts retrieved from the literature, color-coded by their type. Different symbols indicate the literature references according to the legend. For the lensed quasar J0439+1634 we report the 95% confidence interval (red diamonds connected by a line) of intrinsic luminosities by adopting the magnification factor reported in Yang et al. (2019a, see also Sect.4). We use the mean magnification factor as the fiducial value in the fit. Data points with empty symbols are not corrected for gravitational lensing and were excluded from the fit. We also excluded those data reported with dotted error bars as explained in the text. Downward arrows are 3σ upper limits that we also ignored in the fit. The solid purple lines show our best-fit models. The inset panels show the posterior probability distribution of the slope α of the LH2O − LTIR correlations and β for LH2O/LTIR. The best-fit values are reported at the bottom right corner of each panel. For comparison we also show results obtained assuming an exact linear relation (dot-dashed green lines) and the best-fit models, from Yang et al. (2013, as dashed black lines). The shaded areas are 1-σ confidence intervals. References. van der Werf+11 (van der Werf et al. 2011), Combes+12 (Combes et al. 2012), Bothwell+13 (Bothwell et al. 2013), Omont+13 (Omont et al. 2013), Riechers+13 (Riechers et al. 2013), Yang+13,+16 (Yang et al. 2013, 2016), Rawle+14 (Rawle et al. 2014), Apostolovski+19 (Apostolovski et al. 2019), Casey+19 (Casey et al. 2019), Jarugula+21 (Jarugula et al. 2021), Pensabene+21 (Pensabene et al. 2021), Stanley+21 (Stanley et al. 2021).
Current usage metrics show cumulative count of Article Views (full-text article views including HTML views, PDF and ePub downloads, according to the available data) and Abstracts Views on Vision4Press platform.
Data correspond to usage on the plateform after 2015. The current usage metrics is available 48-96 hours after online publication and is updated daily on week days.
Initial download of the metrics may take a while.