Fig. 8.
Download original image
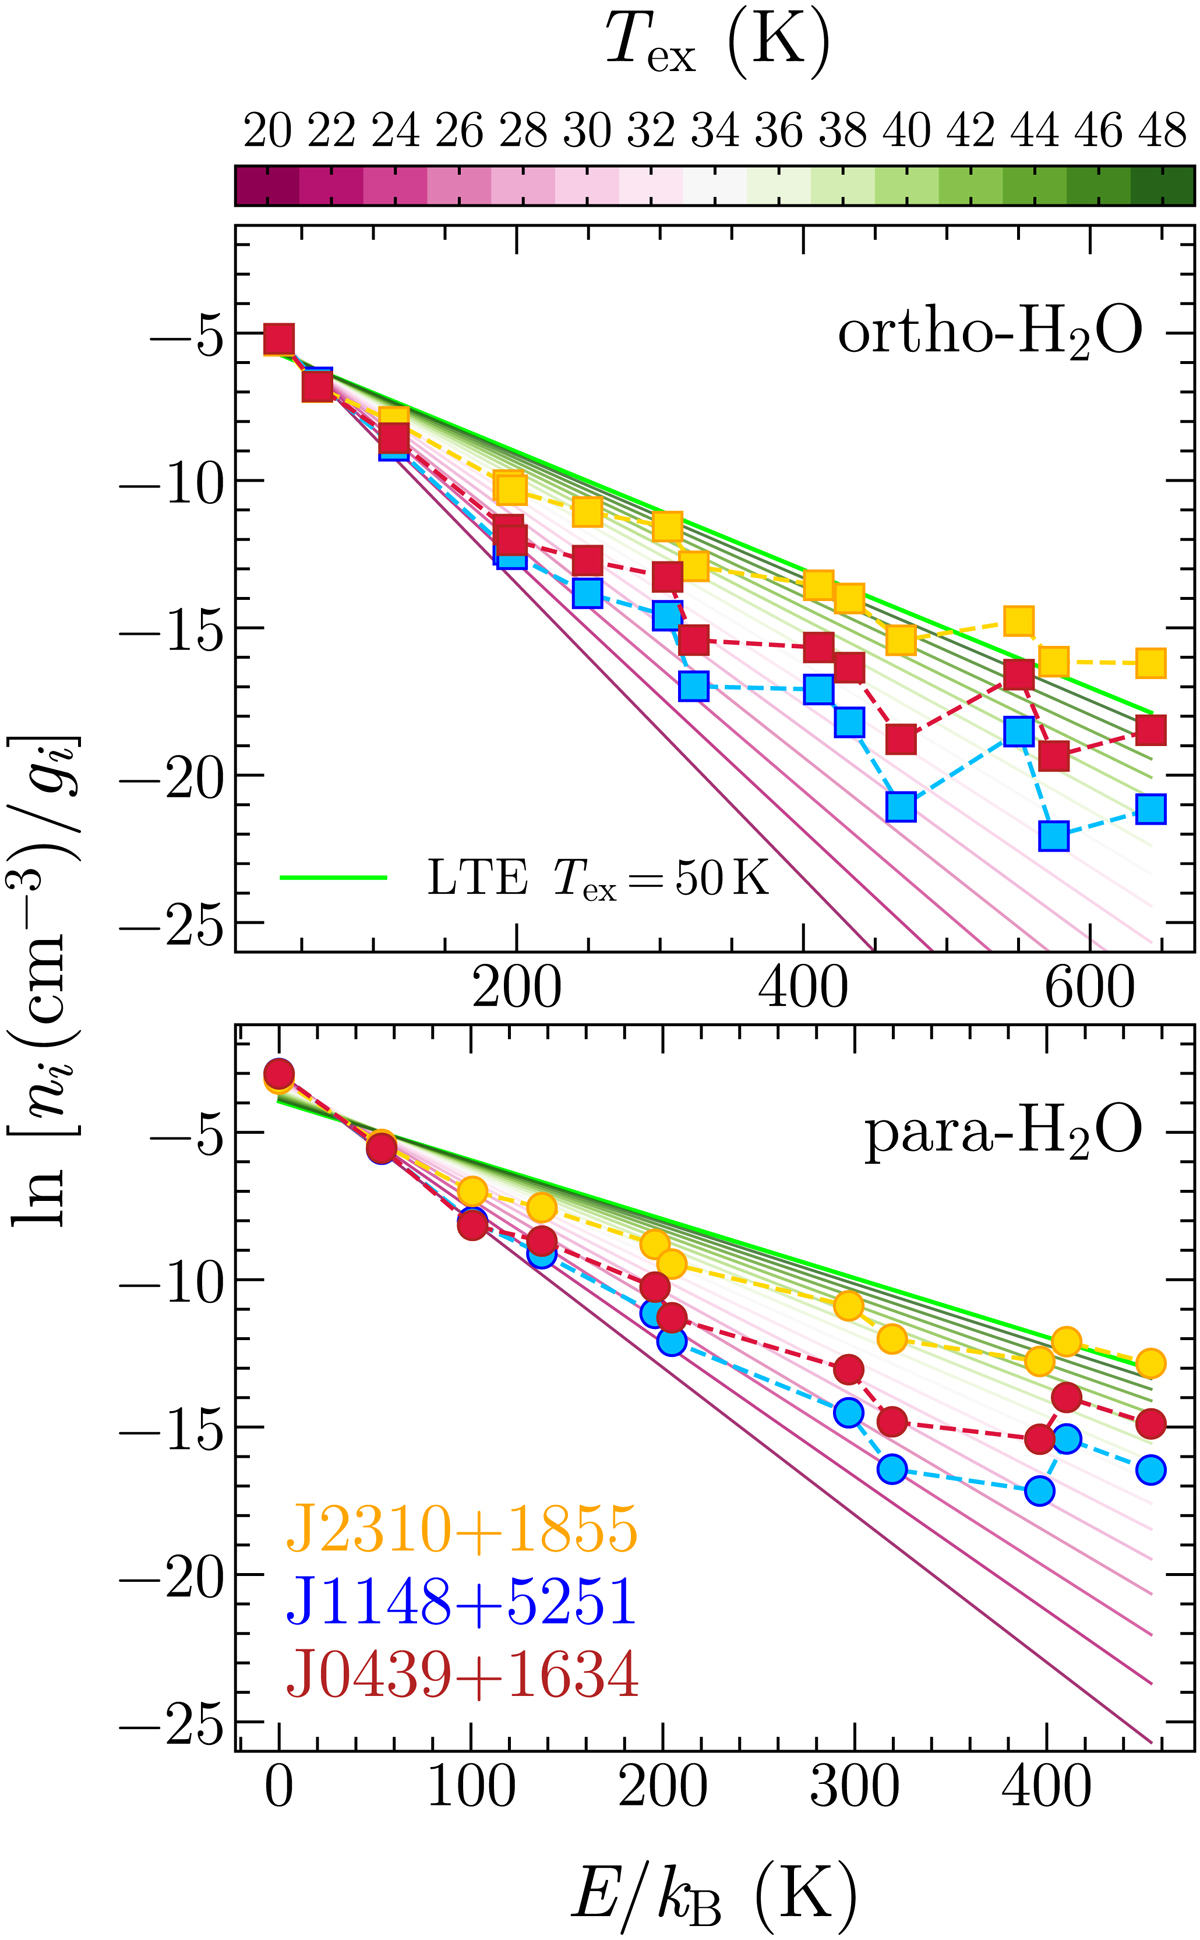
Models of H2O population level diagrams (upper and lower panel, respectively, for ortho- and para-H2O) for our three quasar host galaxies. Each of the model shows the level volume density (weighted with their quantum degeneracy) at the NH2O, τ100, and Tdust values corresponding to the MOLPOP-CEP best-fit H2O SLED models (see Sect. 7.2). The straight lines are the analytical population diagrams computed assuming Boltzmann distribution color-coded by the excitation temperature. The green line corresponds to the LTE case (Tkin = Tex).
Current usage metrics show cumulative count of Article Views (full-text article views including HTML views, PDF and ePub downloads, according to the available data) and Abstracts Views on Vision4Press platform.
Data correspond to usage on the plateform after 2015. The current usage metrics is available 48-96 hours after online publication and is updated daily on week days.
Initial download of the metrics may take a while.