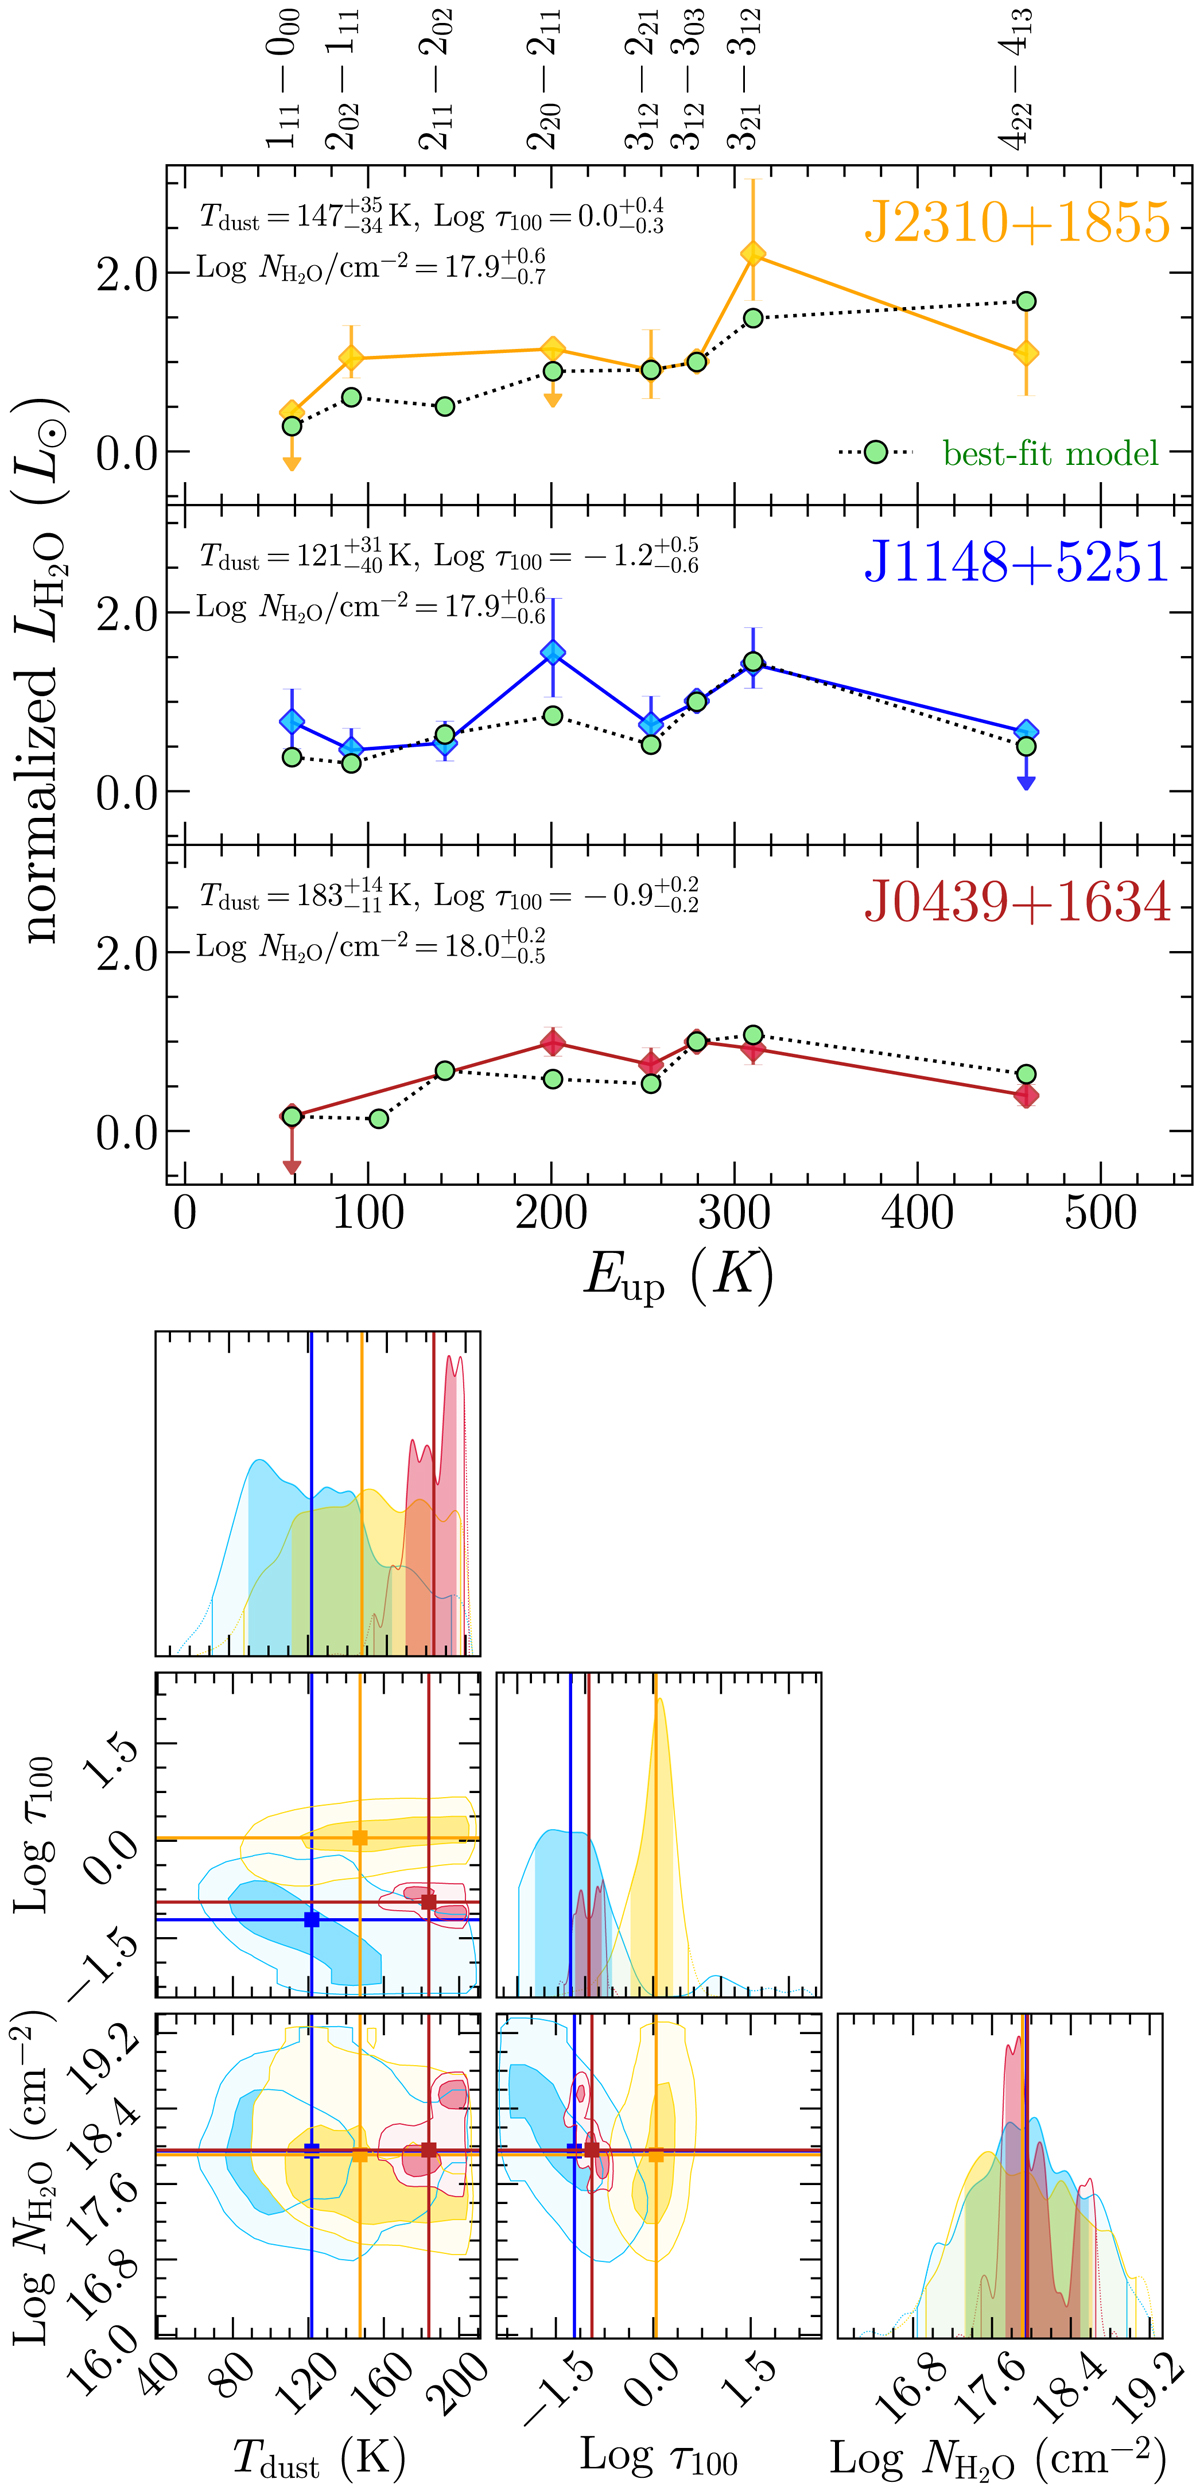
Fig. 7.
Download original image
Modeling of H2O SLEDs of quasar host galaxies. Top panels: colored diamonds are the observed H2O line luminosities normalized to the H2O 312 − 303 line as a function of the energy of the upper level (Eup). The green filled circles are the best-fit models obtained by using our MOLPOP-CEP grids. The best-fit parameters are reported at the top-left corner of each panel. The reported uncertainties take into account only statistical errors ignoring any systematics. Both the Eup and the normalized LH2O are reported in linear scale. Bottom panels: MCMC output posterior probability distributions of free parameters. The contour plots show 1-σ and 2σ confidence intervals. The same intervals are reported in the marginalized distributions.
Current usage metrics show cumulative count of Article Views (full-text article views including HTML views, PDF and ePub downloads, according to the available data) and Abstracts Views on Vision4Press platform.
Data correspond to usage on the plateform after 2015. The current usage metrics is available 48-96 hours after online publication and is updated daily on week days.
Initial download of the metrics may take a while.