Fig. 6.
Download original image
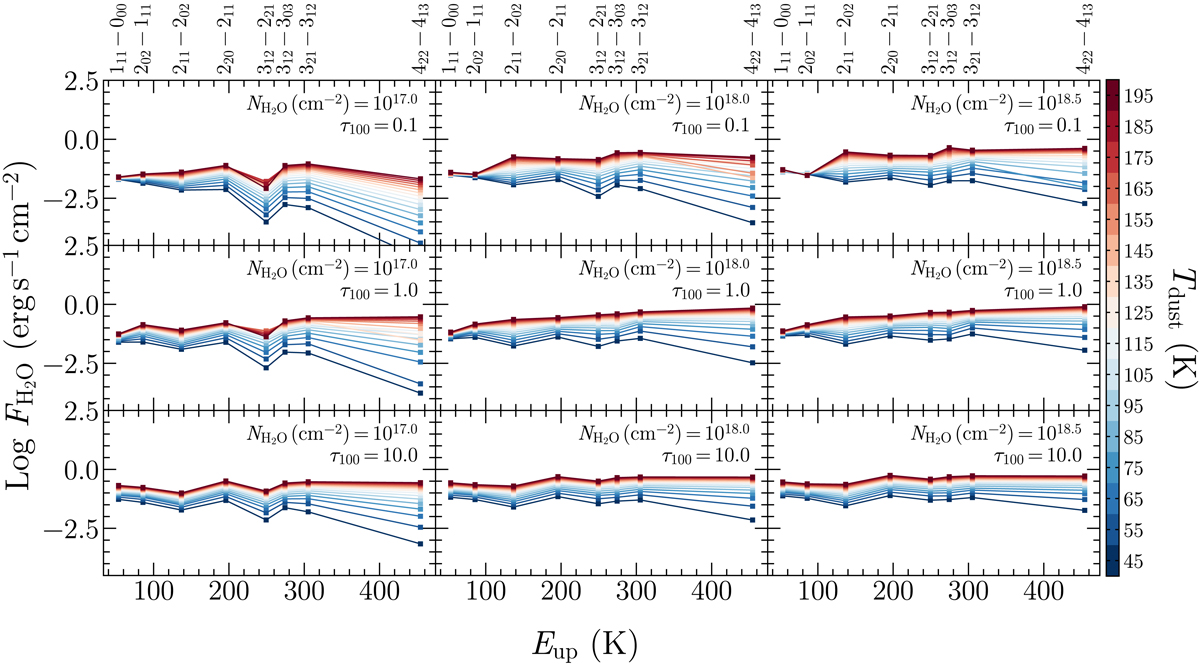
H2O line fluxes as a function of the energy of the upper levels obtained from our MOLPOP-CEP runs. Here we report output predictions for different values of water vapor column density (from left to rightNH2O = 1017, 1018, 1018.5 cm−2) and continuum optical depth (from top to bottomτ100 = 0.1, 1.0, 10) as reported at the upper right corner of each panel. The H2O fluxes in each panel are color-coded according to the dust temperature (Tdust).
Current usage metrics show cumulative count of Article Views (full-text article views including HTML views, PDF and ePub downloads, according to the available data) and Abstracts Views on Vision4Press platform.
Data correspond to usage on the plateform after 2015. The current usage metrics is available 48-96 hours after online publication and is updated daily on week days.
Initial download of the metrics may take a while.