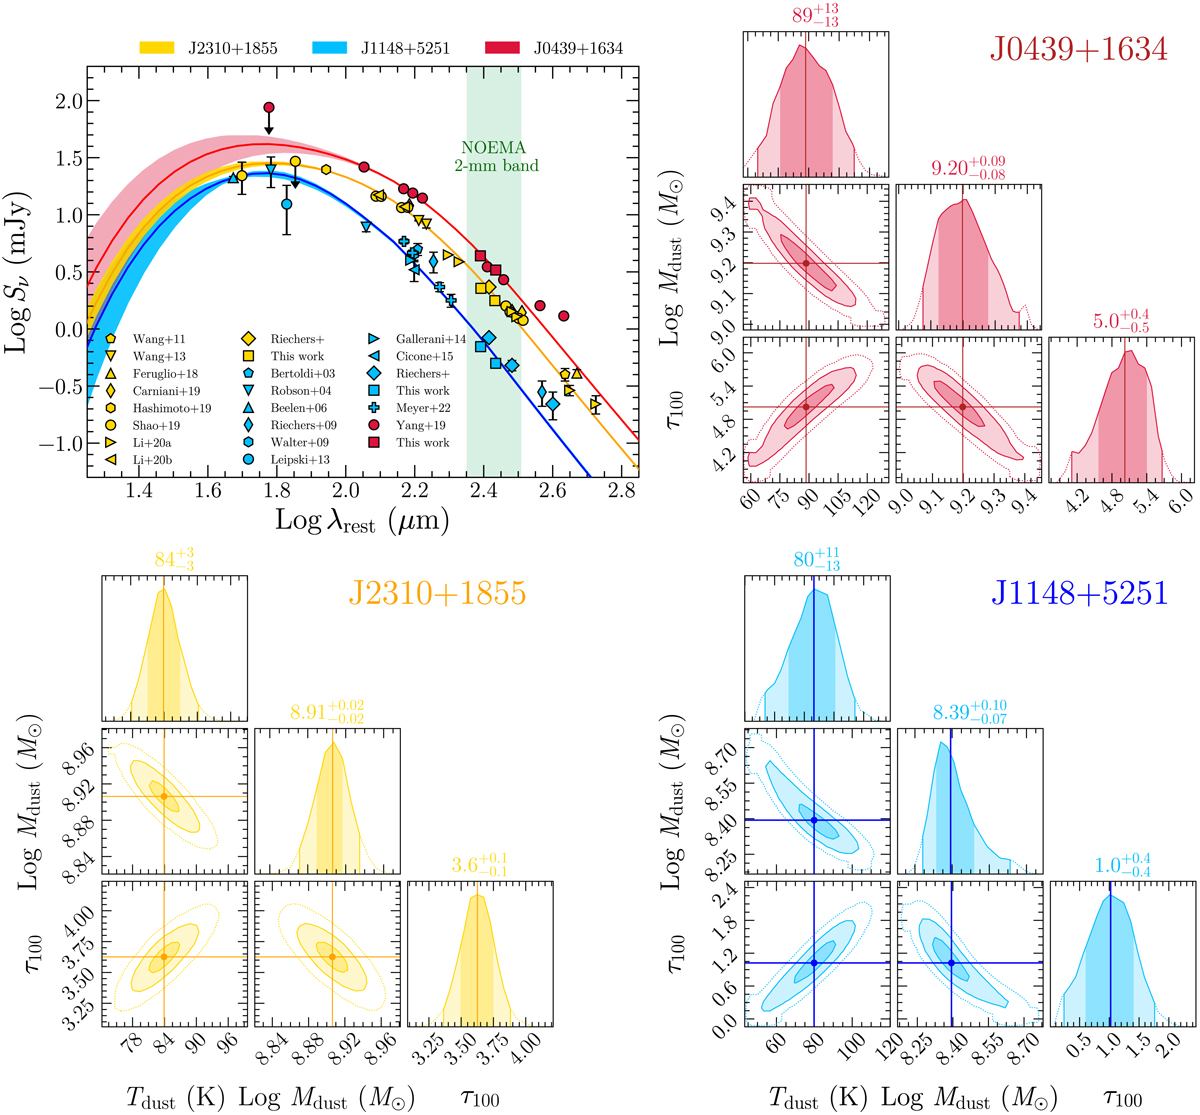
Fig. 4.
Download original image
Infrared dust continuum SED modeling of J2310+1855 (yellow), J1148+5251 (blue), and J0439+1634 (red). The upper-left panel shows continuum data retrieved from the literature derived for the wavelength range λrest ≈ 50 − 1000 μm and our NOEMA 2-mm continuum measurements (see the legend). The solid curves are the best-fit models to the observed data while shaded areas indicate the 1-σ confidence intervals. The green band is the 2-mm wide-band of the NOEMA PolyFix correlator scaled to the quasar rest frame wavelengths using the average redshift of the quasars. The adjacent panels show the posterior probability distribution of the dust SED model (free) parameters. The best-fit values and uncertainties are reported at the top of the distributions and they are defined as the 50th, 16th, and 84th percentiles. The 2D contours show the [1, 2, 3]σ confidence intervals that are also highlighted in the marginalized distributions. References. Bertoldi+03 (Bertoldi et al. 2003a); Robson+04 (Robson et al. 2004); Beelen+06 (Beelen et al. 2006), Riechers+09,+ (Riechers et al. 2009, Riechers et al. in prep.); Walter+09 (Walter et al. 2009); Wang+11,+13 (Wang et al. 2011, 2013); Leipski+13 (Leipski et al. 2013); Gallerani+14 (Gallerani et al. 2014); Cicone+15 (Cicone et al. 2015); Feruglio+18 (Feruglio et al. 2018); Carniani+19 (Carniani et al. 2019); Hashimoto+19 (Hashimoto et al. 2019); Shao+19 (Shao et al. 2019); Yang+19 (Yang et al. 2019a); Li+20a,+20b (Li et al. 2020a,b); Meyer+22 (Meyer et al. 2022).
Current usage metrics show cumulative count of Article Views (full-text article views including HTML views, PDF and ePub downloads, according to the available data) and Abstracts Views on Vision4Press platform.
Data correspond to usage on the plateform after 2015. The current usage metrics is available 48-96 hours after online publication and is updated daily on week days.
Initial download of the metrics may take a while.