Fig. 2.
Download original image
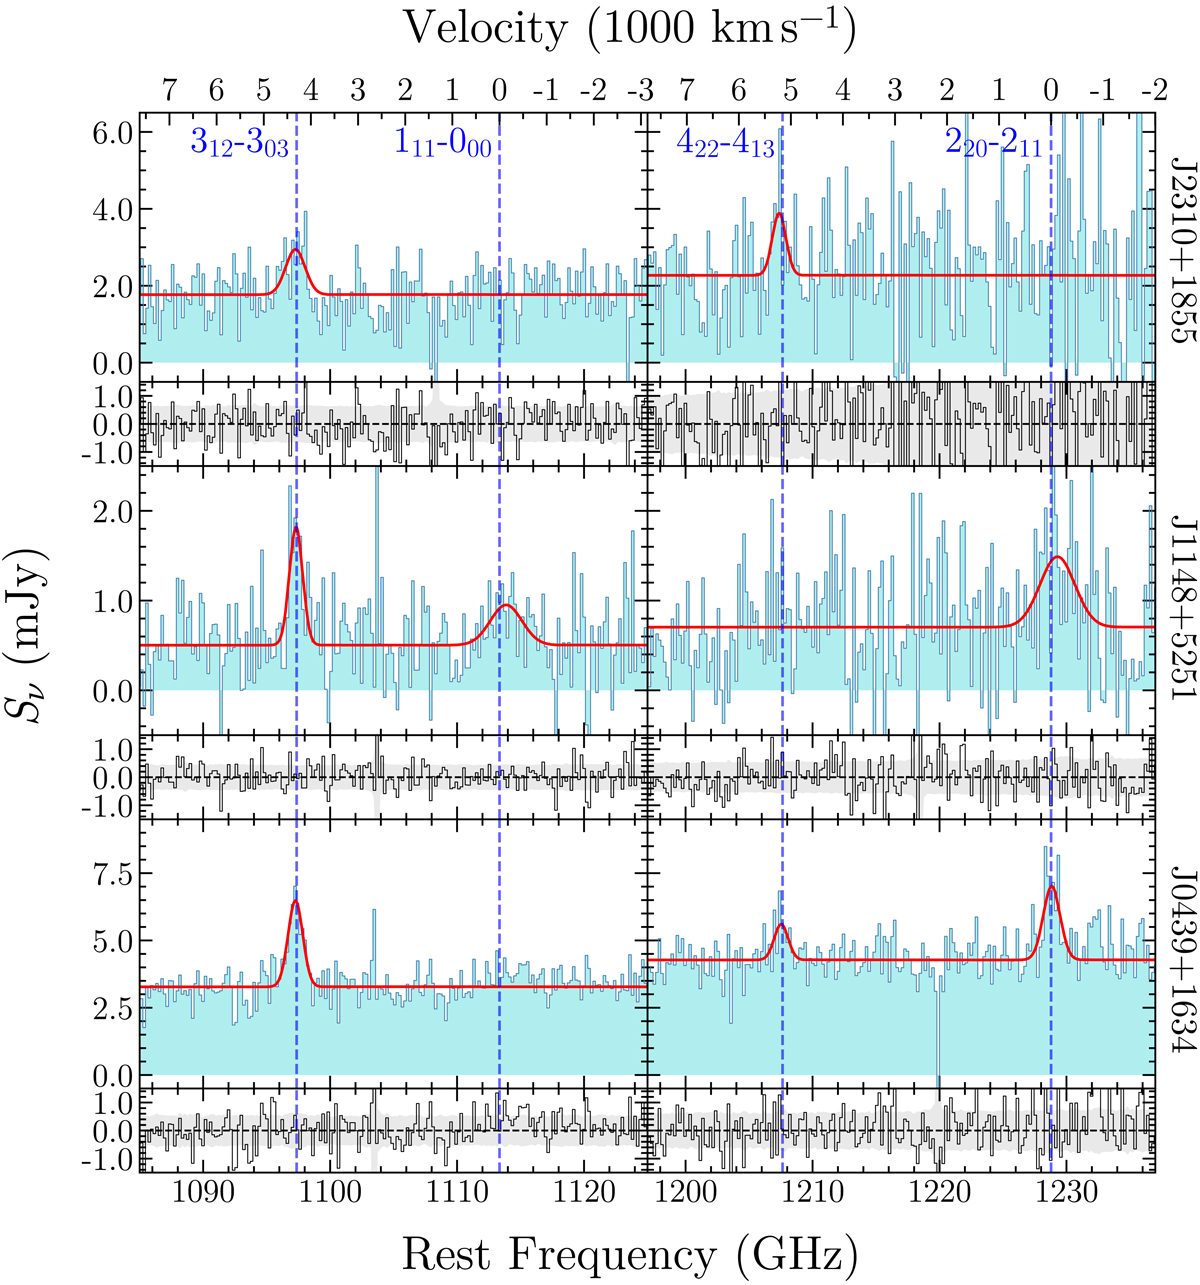
NOEMA spectra of the three z > 6 quasars J2310+1855, J1148+5251 and J0439+1634 (from top to bottom). We report the observed data in light blue and the best-fit models in red. The blue dashed lines indicate the rest frequencies of the targeted H2O transitions (quantum numbers are also reported). At the bottom of each spectra, we report the residuals (data-model). The gray-shaded areas show the noise RMS across the spectra.
Current usage metrics show cumulative count of Article Views (full-text article views including HTML views, PDF and ePub downloads, according to the available data) and Abstracts Views on Vision4Press platform.
Data correspond to usage on the plateform after 2015. The current usage metrics is available 48-96 hours after online publication and is updated daily on week days.
Initial download of the metrics may take a while.