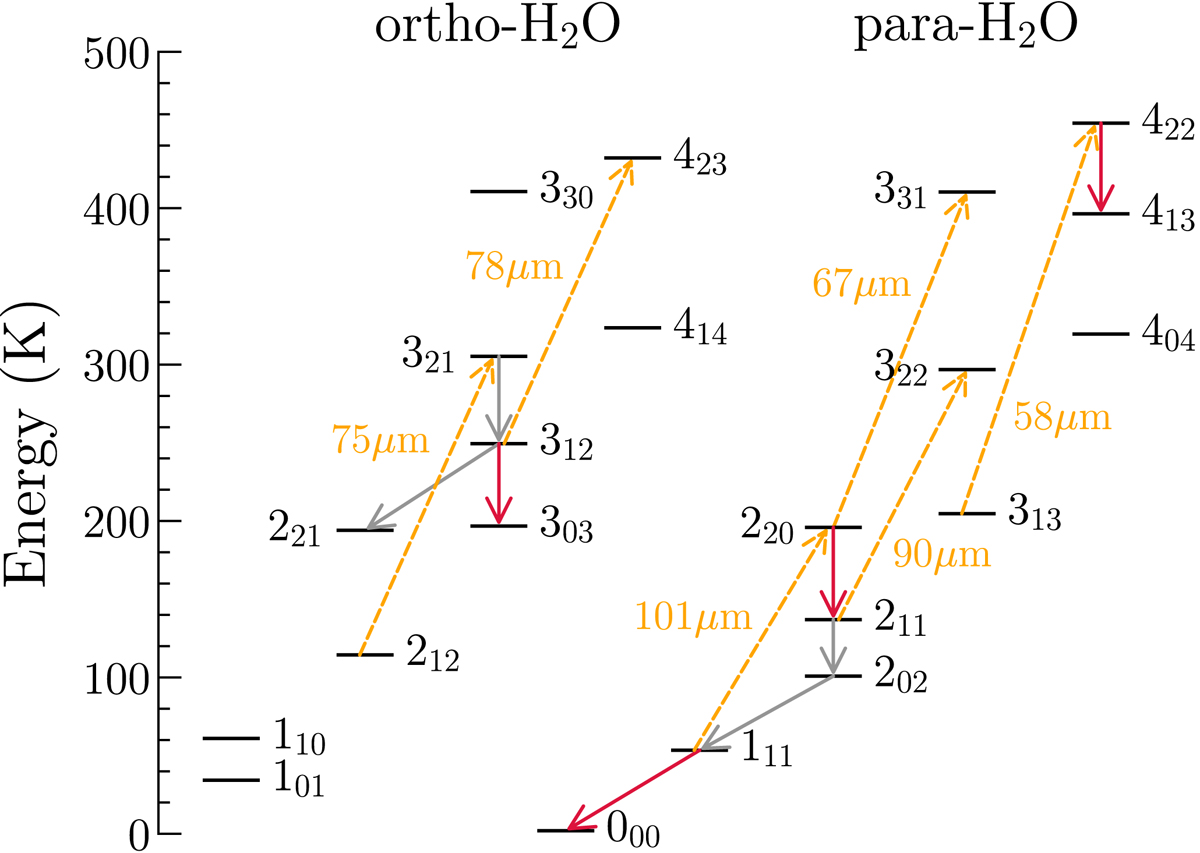
Fig. 1.
Download original image
Energy level diagram of H2O. Downward solid red and gray arrows are the transitions reported in this paper and those available in the literature (see Yang et al. 2019a, Li et al. 2020b, Riechers et al., in prep.). The upward dashed orange arrows indicate the FIR H2O pumping (absorption) lines of interest. The respective wavelengths are also reported.
Current usage metrics show cumulative count of Article Views (full-text article views including HTML views, PDF and ePub downloads, according to the available data) and Abstracts Views on Vision4Press platform.
Data correspond to usage on the plateform after 2015. The current usage metrics is available 48-96 hours after online publication and is updated daily on week days.
Initial download of the metrics may take a while.