Fig. 7

Download original image
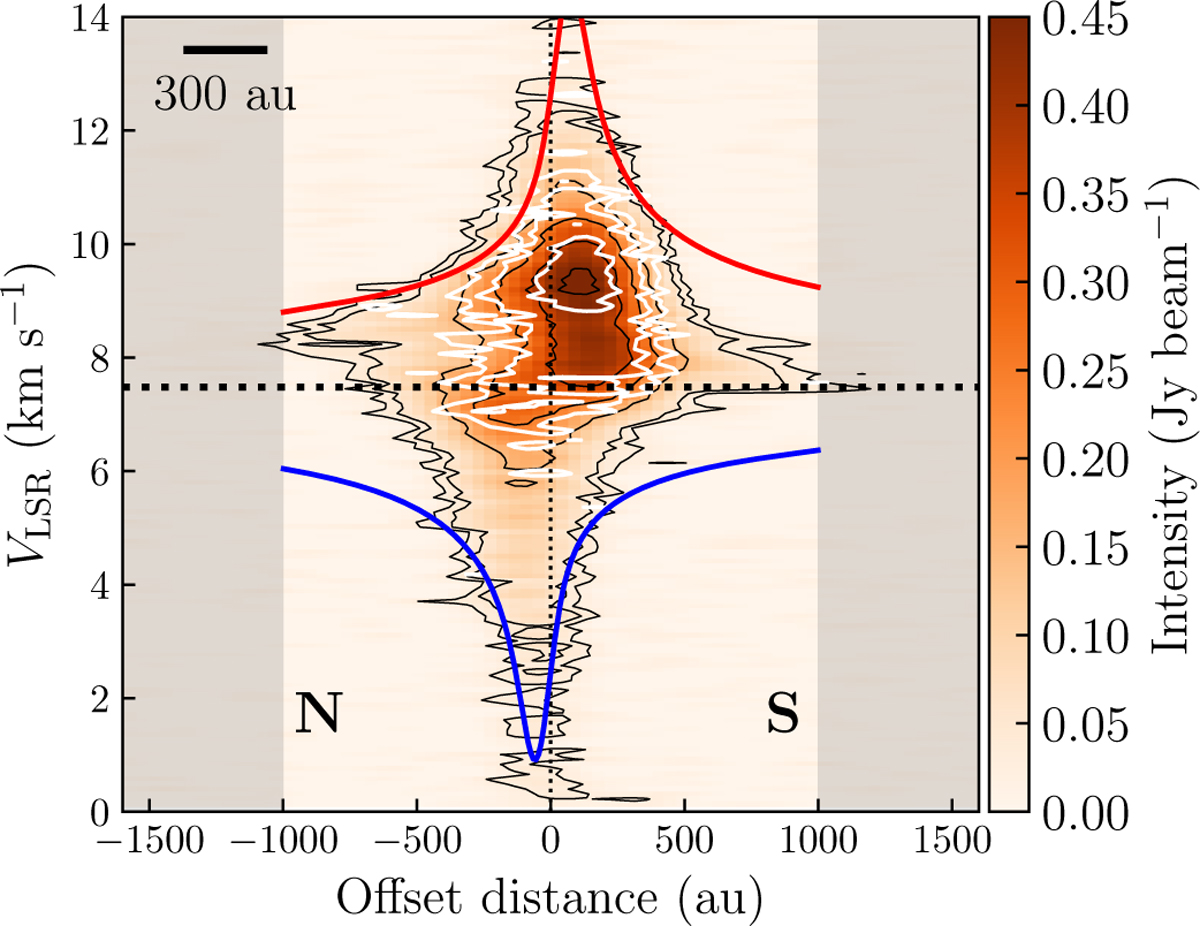
Position-Velocity diagram of SO(55–44) (colored and black contours) and SO2(white contours) line emission along the position angle of the disk from Segura-Cox et al. (2016), plotted along the same offset scale as the right panel of Fig. 3. Negative offsets represent distances toward the north and positive offsets toward the south. The horizontal dotted line represents Per-emb-50’s VLSR = 7.48 km s−1. The vertical dotted line marks the central position of Per-emb-50. Both PV diagrams have an rms of 0.01 Jy beam−1. Intensity contours for SO are placed at 3, 5, 15, 25, 35, and 45 times the rms, whereas SO2 intensity contours are placed at 3, 5, and 10 times the rms. The red and blue solid curves show the model of rotation and infall that best match the SO for the redshifted and blueshifted velocities with respect to the protostar, respectively. The scalebar in the top left represents a distance of 300 au, equivalent to the resolution of the NOEMA data.
Current usage metrics show cumulative count of Article Views (full-text article views including HTML views, PDF and ePub downloads, according to the available data) and Abstracts Views on Vision4Press platform.
Data correspond to usage on the plateform after 2015. The current usage metrics is available 48-96 hours after online publication and is updated daily on week days.
Initial download of the metrics may take a while.


