Fig. 5

Download original image
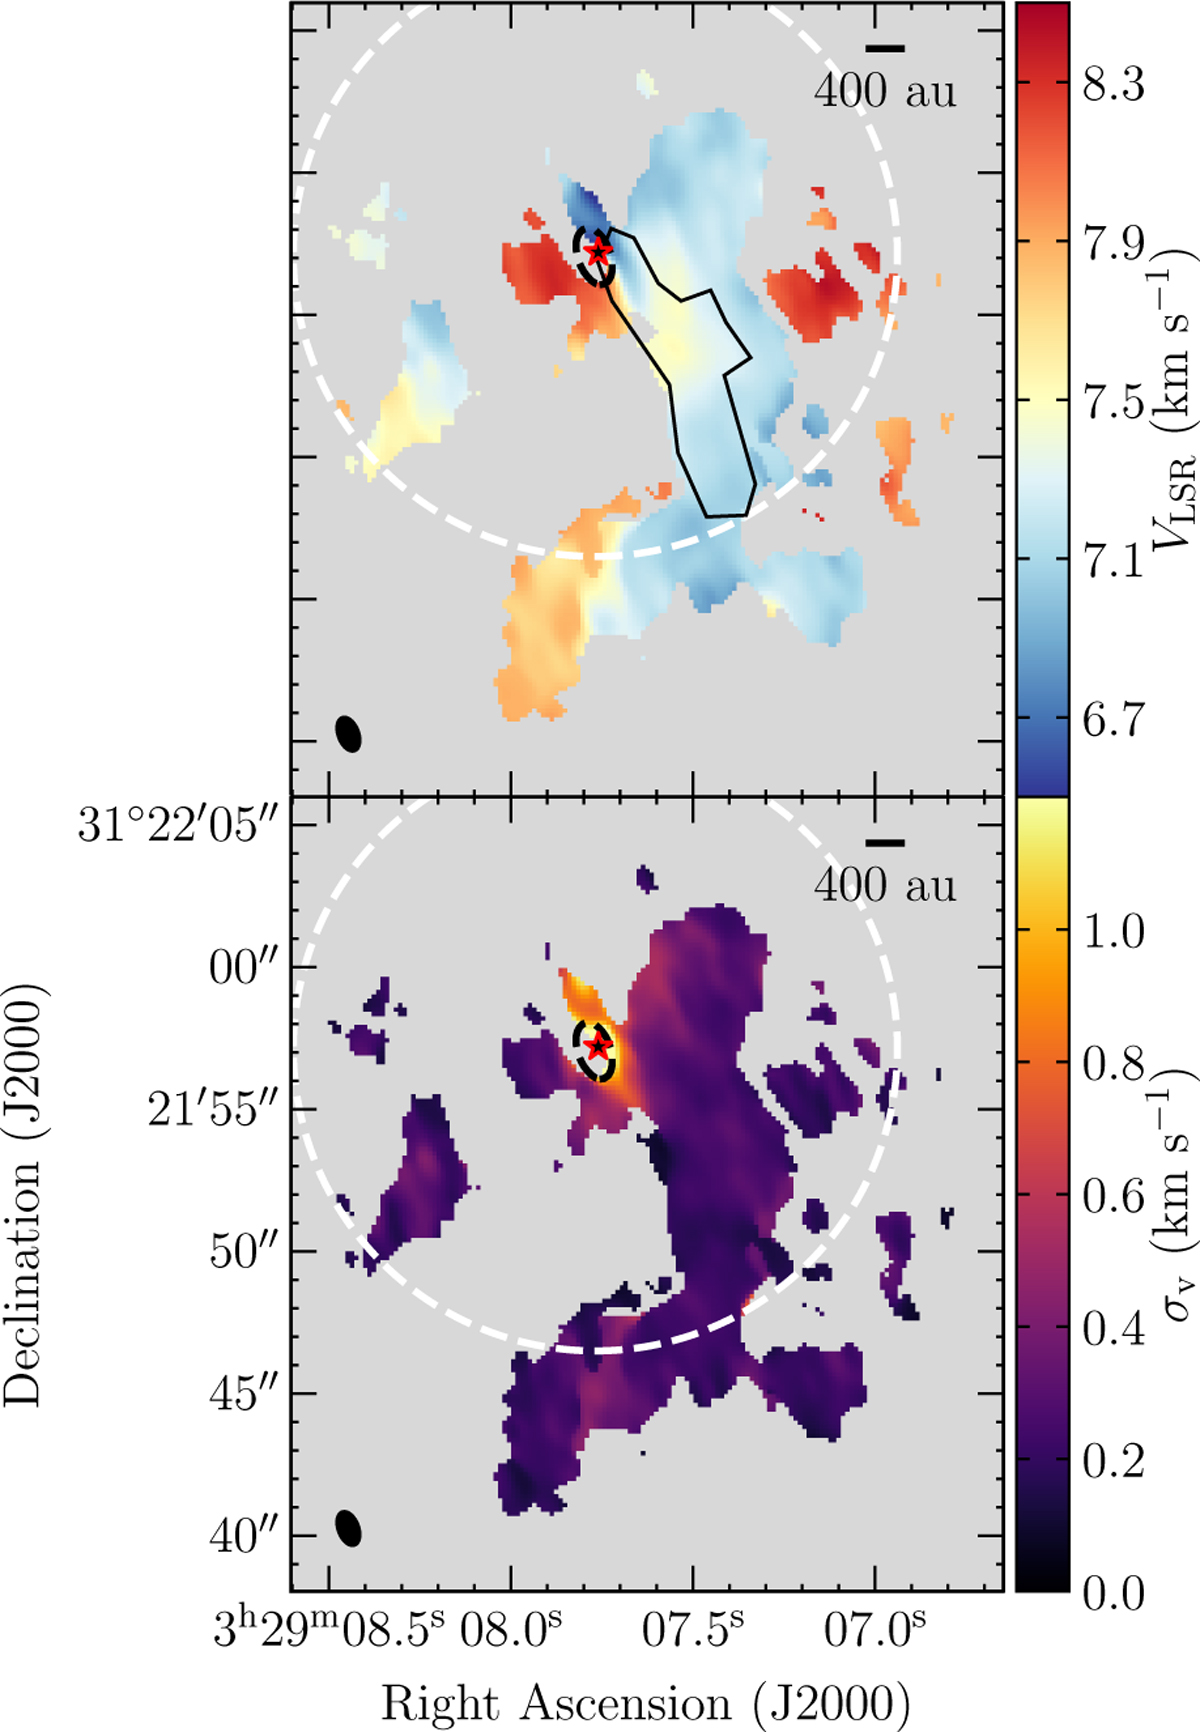
Velocity VLSR and velocity dispersion σv of the best Gaussian fit for C18O emission. Gaussian fits are only done for spectra with S/N > 4. The primary beam FWHM size is represented with a white dashed circle. The beam size is represented in a white ellipse in the bottom left corner. Top: central velocity of the best fit Gaussian profile for each spectrum. The black contour shows the same region plotted in the right panel of Fig. 2, from where the mass is calculated. Bottom: velocity dispersion of the best fit Gaussian profile for each spectrum.
Current usage metrics show cumulative count of Article Views (full-text article views including HTML views, PDF and ePub downloads, according to the available data) and Abstracts Views on Vision4Press platform.
Data correspond to usage on the plateform after 2015. The current usage metrics is available 48-96 hours after online publication and is updated daily on week days.
Initial download of the metrics may take a while.


