Fig. 4
Download original image
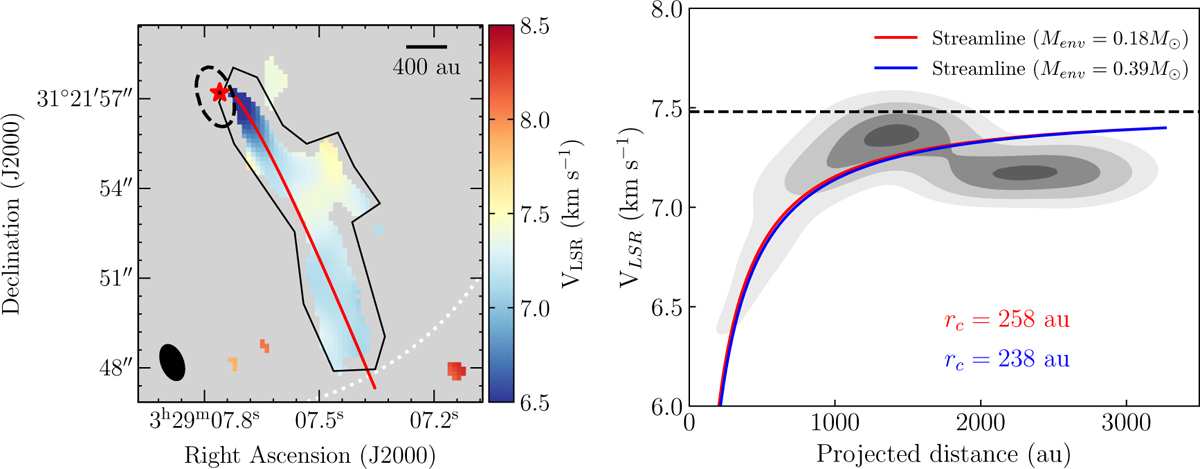
Central velocity of the best fit for each spectra in the H2CO line emission, together with the streamline model for H2CO. The red and blue lines represent the best streamline model for an envelope mass of 0.18 M⊙ (total central mass of 2.47 M⊙) and 0.39 M⊙ (total mass of 2.68 M⊙), respectively. Left: central velocities with respect to position in the sky. The black polygon represents the region where velocities are sampled to build the kernel density estimation (KDE). The primary beam FWHM size is represented with a dashed white circle. The beam size is represented by a black ellipse in the bottom left corner. Right: central velocity KDE as a function of projected distance to Per-emb-50 is plotted in grayscale. The KDE levels are drawn from 0.5σ in steps of 0.5σ, where the σ level is equivalent to the standard deviation of a normalized bivariate normal distribution. The horizontal dashed line represents the central velocity of Per-emb-50 VLSR = 7.5 km s−1. The centrifugal radius resulting from each envelope mass are located below the curve.
Current usage metrics show cumulative count of Article Views (full-text article views including HTML views, PDF and ePub downloads, according to the available data) and Abstracts Views on Vision4Press platform.
Data correspond to usage on the plateform after 2015. The current usage metrics is available 48-96 hours after online publication and is updated daily on week days.
Initial download of the metrics may take a while.