Fig. 3
Download original image
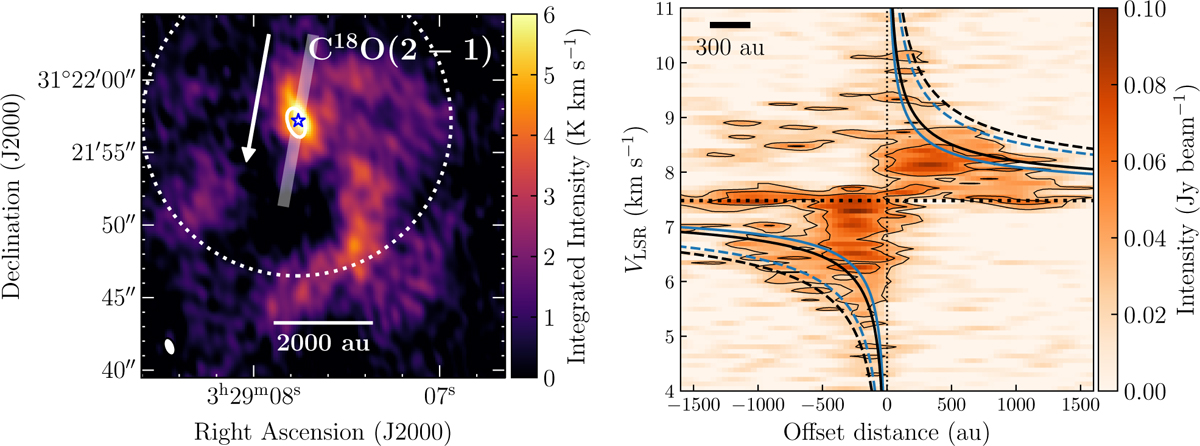
C18O integrated emission before primary beam correction alongside its PV diagram. Left: integrated intensity image of C18O between −1 and 14 km s−1. The semitransparent white line represents the position and width of the PV cut, built with the position angle of the disk from Segura-Cox et al. (2016). The white arrow represents the direction of positive offset of the PV cut. The primary beam FWHM size is represented with a dashed white circle. The beam size is represented by a white ellipse in the bottom left corner. Right: PV diagram of the C18O line emission along the indicated PV cut. The horizontal dotted line represents Per-emb-50’s VLSR = 7.5 km s−1. The vertical dotted line marks the central position of Per-emb-50. The PV diagram has an rms of 0.01 Jy beam−1. Intensity contours are placed at 5, 15, and 25 times the rms. The blue and black curves represent the Keplerian rotation curve for the minimum and maximum stellar mass, respectively, from Fiorellino et al. (2021): the solid lines represent masses calculated assuming the star is located at the birthline of the Palla & Stahler (1993) model (0.53–0.70 M⊙), whereas dashed lines represent the masses calculated for a 1 Myr protostar (1.52–1.90 M⊙). Velocities are weighted according to the inclination angle as v = vkep sin(i). The preferred Keplerian curve is the average between the dashed curves, with a mass of 1.7 M⊙. The scalebar in the top left represents a distance of 300 au, equivalent to the resolution of the NOEMA data.
Current usage metrics show cumulative count of Article Views (full-text article views including HTML views, PDF and ePub downloads, according to the available data) and Abstracts Views on Vision4Press platform.
Data correspond to usage on the plateform after 2015. The current usage metrics is available 48-96 hours after online publication and is updated daily on week days.
Initial download of the metrics may take a while.