Fig. 2
Download original image
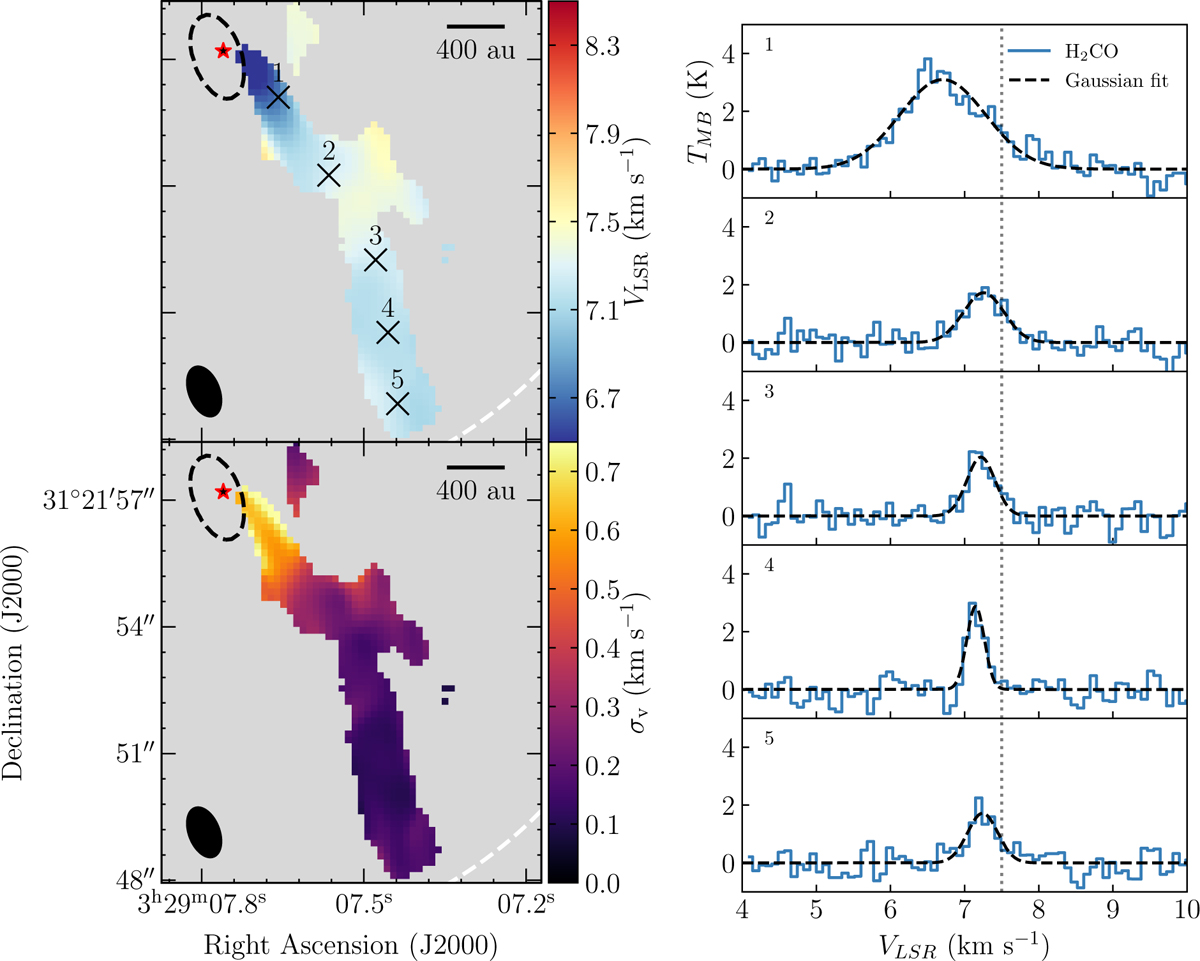
Results of the Gaussian fit to the H2CO line emission toward Per-emb-50. Left: central velocity VLSR and velocity dispersion σv of the H2CO streamer are shown in the top and bottom panels, respectively. These are obtained from the Gaussian model for H2CO emission of each spectra with S/N > 4. The red star represents the central position of Per-emb-50. Black labeled crosses mark the positions where we extract spectra, shown to the right. Dashed black contours correspond to the continuum emission at a brightness level of 7 mJy beam−1 (see Fig. A.1). Dashed white lines represent the primary beam FWHM, centered at the location of Per-emb-50. The beam is drawn in the lower left corners of each image. Right: H2CO spectra at selected positions along the streamer, together with the Gaussian that best fits each spectrum. Blue lines indicate the H2CO spectra and the dashed black lines represent the best fit Gaussian function. The uncertainty in TMB is 0.3 K. The dotted gray line represents the protostar’s Vlsr = 7.5 km s−1.
Current usage metrics show cumulative count of Article Views (full-text article views including HTML views, PDF and ePub downloads, according to the available data) and Abstracts Views on Vision4Press platform.
Data correspond to usage on the plateform after 2015. The current usage metrics is available 48-96 hours after online publication and is updated daily on week days.
Initial download of the metrics may take a while.