Fig. E.1
Download original image
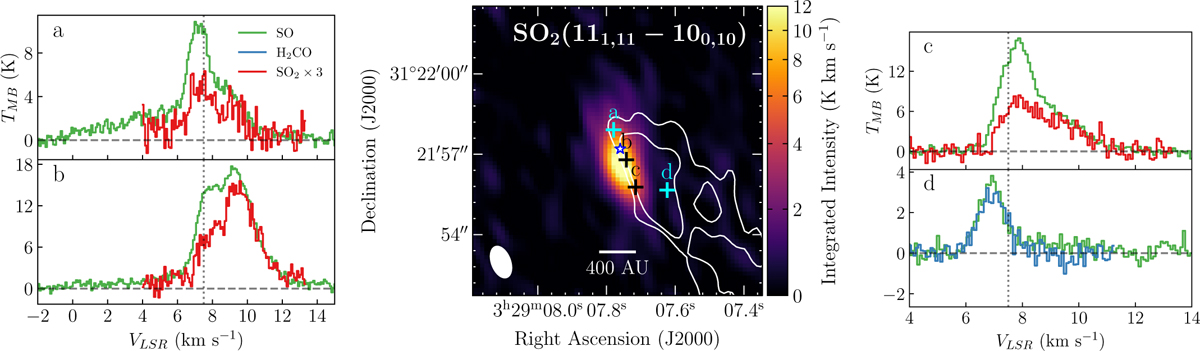
Velocity integrated SO2(111,11 – 100,10) together with sample spectra of SO2, SO, and H2CO at positions a to d. Left and right: Beam averaged spectra at positions a to d. Each color represents the spectrum of a molecule: blue corresponds to H2CO, green to SO and red to SO2. The dotted vertical line marks the central velocity of the protostar VLSR = 7.5 km s−1. The dashed horizontal line represents the 0 K level. If a molecule does not appear at a panel, its because emission from that molecule has a S/N < 5. Middle: Velocity integrated image of the SO2(111,11 – 100,10) molecular transition. The crosses represent the places where each spectrum was extracted, labeled from a to d. The white contours represent the three and five times the rms of the integrated map contours of H2CO (0.25 K km s−1). The white ellipse in the bottom left corner represents the beam size. The blue star marks the position of Per-emb-50.
Current usage metrics show cumulative count of Article Views (full-text article views including HTML views, PDF and ePub downloads, according to the available data) and Abstracts Views on Vision4Press platform.
Data correspond to usage on the plateform after 2015. The current usage metrics is available 48-96 hours after online publication and is updated daily on week days.
Initial download of the metrics may take a while.