Fig. 1
Download original image
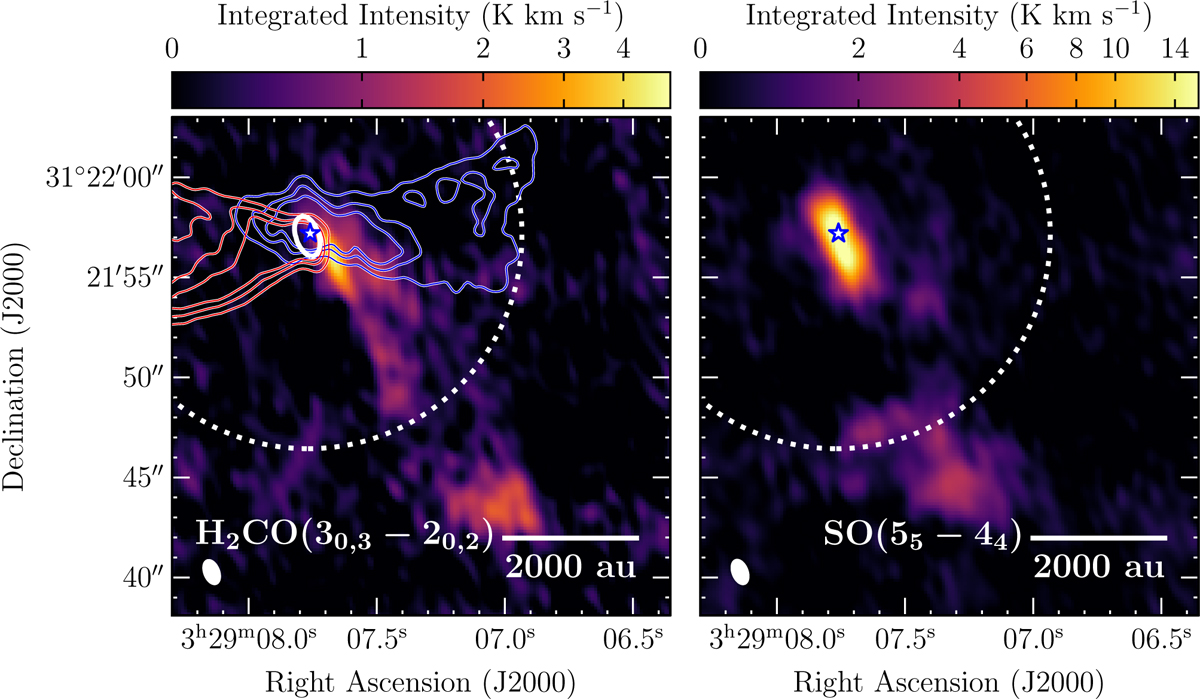
Integrated intensity images of H2CO (30.3–20.2) and SO(55–44), before primary beam correction, are shown on the left and right, respectively. Primary beam FWHM sizes are represented with filled dashed white circles in each image. The blue star represents the location of Per-emb-50. Beam sizes are represented by white ellipses in the bottom left corner of each image. Left: H2CO(30.3–20.2) integrated intensity between 5.5 and 9.5 km s−1. Red and blue contours correspond to the redshifted and blueshifted emisions coming from the outflow, respectively, traced in our wideband 12CO(2–1) emission. Contour levels are shown at 8, 16, and 24 K km s−1. The white contour represents the continuum emission at a 7 mJy beam−1 level (see Fig. A.1). Right: SO (55–44) integrated intensity between −1 and 14 km s−1.
Current usage metrics show cumulative count of Article Views (full-text article views including HTML views, PDF and ePub downloads, according to the available data) and Abstracts Views on Vision4Press platform.
Data correspond to usage on the plateform after 2015. The current usage metrics is available 48-96 hours after online publication and is updated daily on week days.
Initial download of the metrics may take a while.