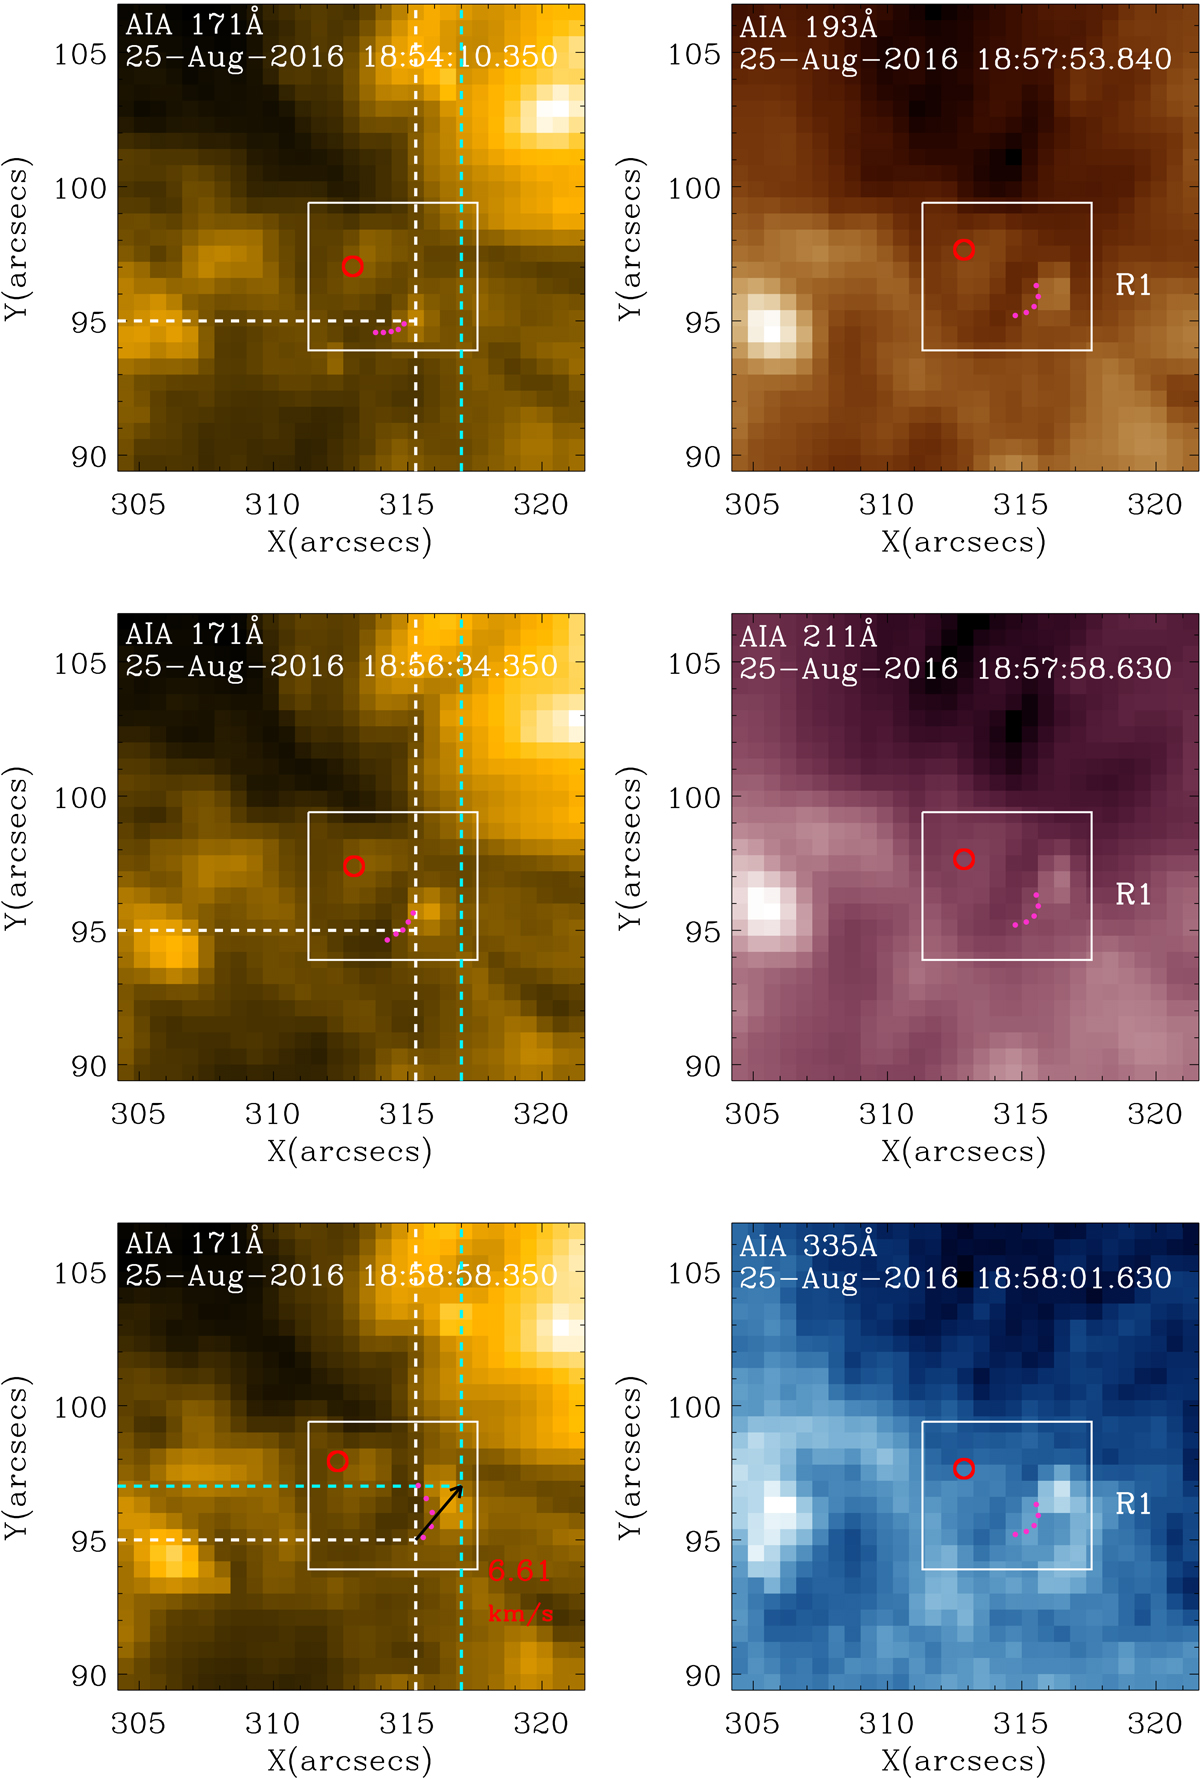
Fig. 7.
Download original image
Corona response observed with the different filters of SDO/AIA. R1 represents the area where the jet occurred. The footpoint and front of the jet are marked by red circle and magenta dots, respectively, as in Fig. 1. The brightening displacement and speed are marked on the bottom left corner panel with an arrow and a value of 6.61 km s−1.
Current usage metrics show cumulative count of Article Views (full-text article views including HTML views, PDF and ePub downloads, according to the available data) and Abstracts Views on Vision4Press platform.
Data correspond to usage on the plateform after 2015. The current usage metrics is available 48-96 hours after online publication and is updated daily on week days.
Initial download of the metrics may take a while.