Open Access
Fig. 4.
Download original image
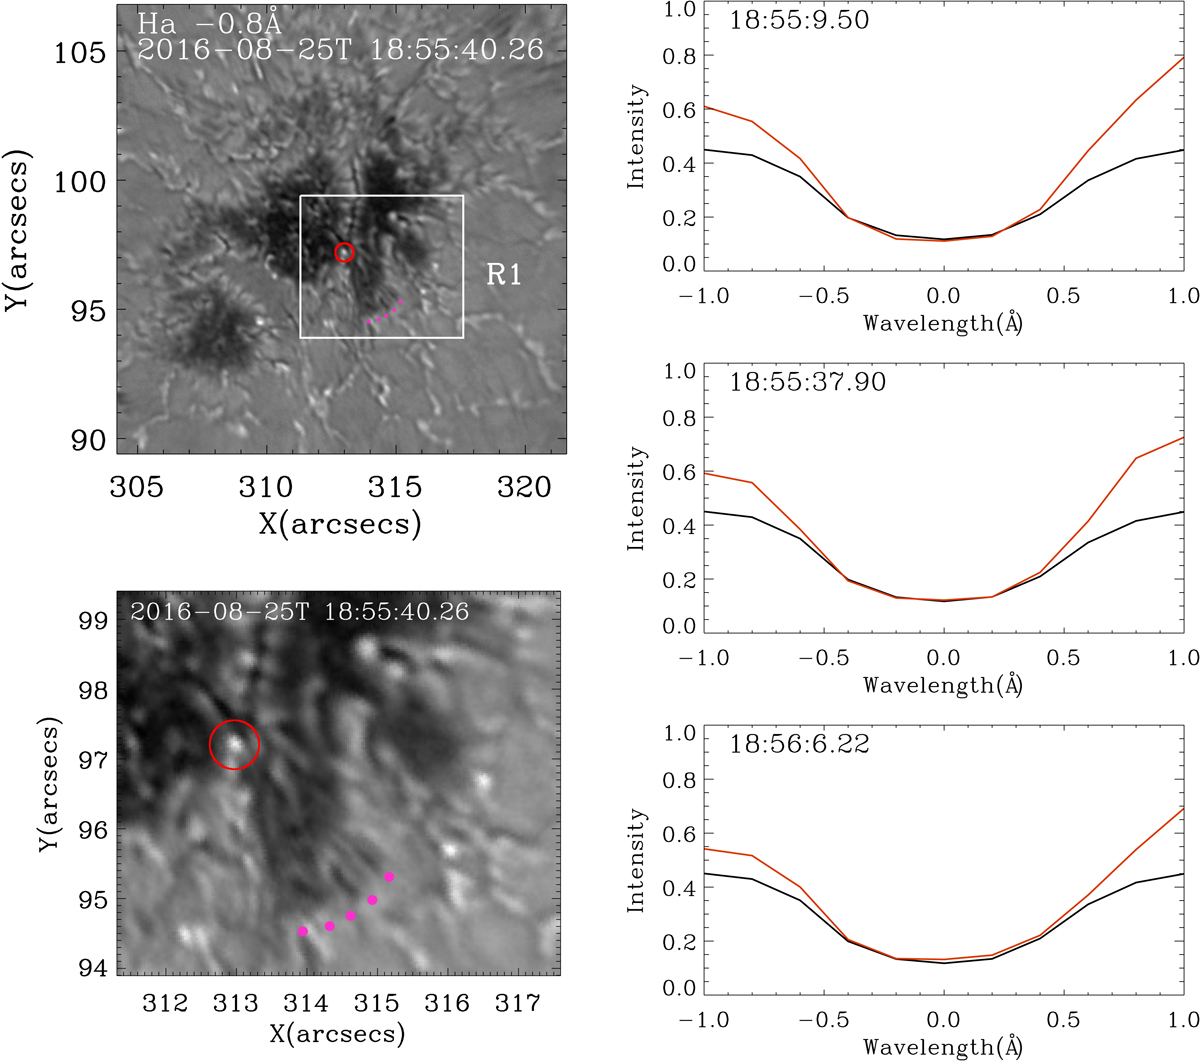
Footpoint (red circle) and front of the jet (magenta dots) are marked in R1 region and in a zoom-in area of R1 (left panels). Normalized Hα spectral profile (red line) at the footpoint of the jet and reference profile (black line) for three times during magnetic reconnection are shown in the right panels.
Current usage metrics show cumulative count of Article Views (full-text article views including HTML views, PDF and ePub downloads, according to the available data) and Abstracts Views on Vision4Press platform.
Data correspond to usage on the plateform after 2015. The current usage metrics is available 48-96 hours after online publication and is updated daily on week days.
Initial download of the metrics may take a while.