Open Access
Fig. 3.
Download original image
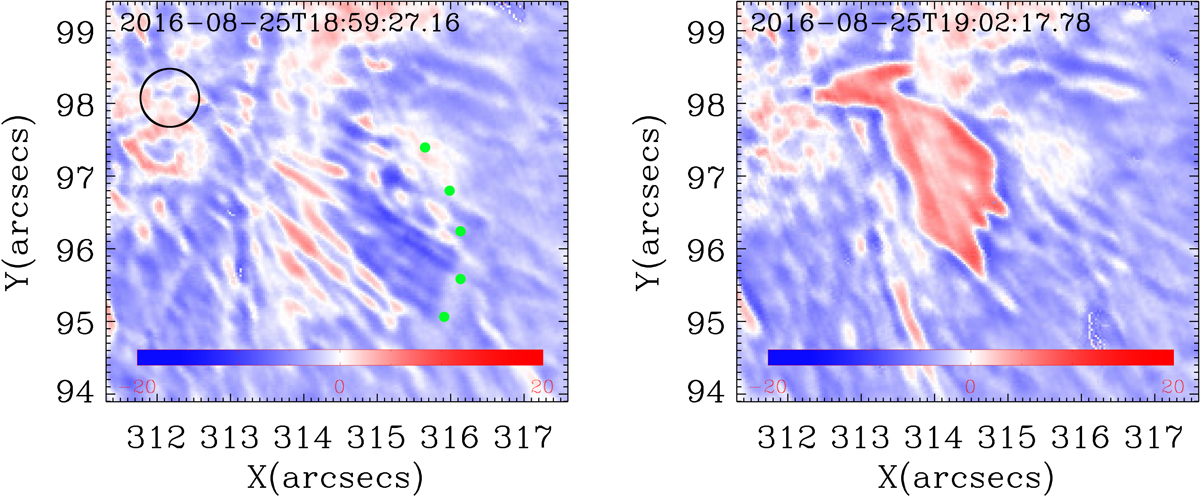
LoS Doppler velocity maps obtained from GST/VIS of the zoom-in area of R1 (same field of view as in Fig. 4 bottom left). The footpoint and front of the jet are marked by a black circle and green dots, respectively.
Current usage metrics show cumulative count of Article Views (full-text article views including HTML views, PDF and ePub downloads, according to the available data) and Abstracts Views on Vision4Press platform.
Data correspond to usage on the plateform after 2015. The current usage metrics is available 48-96 hours after online publication and is updated daily on week days.
Initial download of the metrics may take a while.