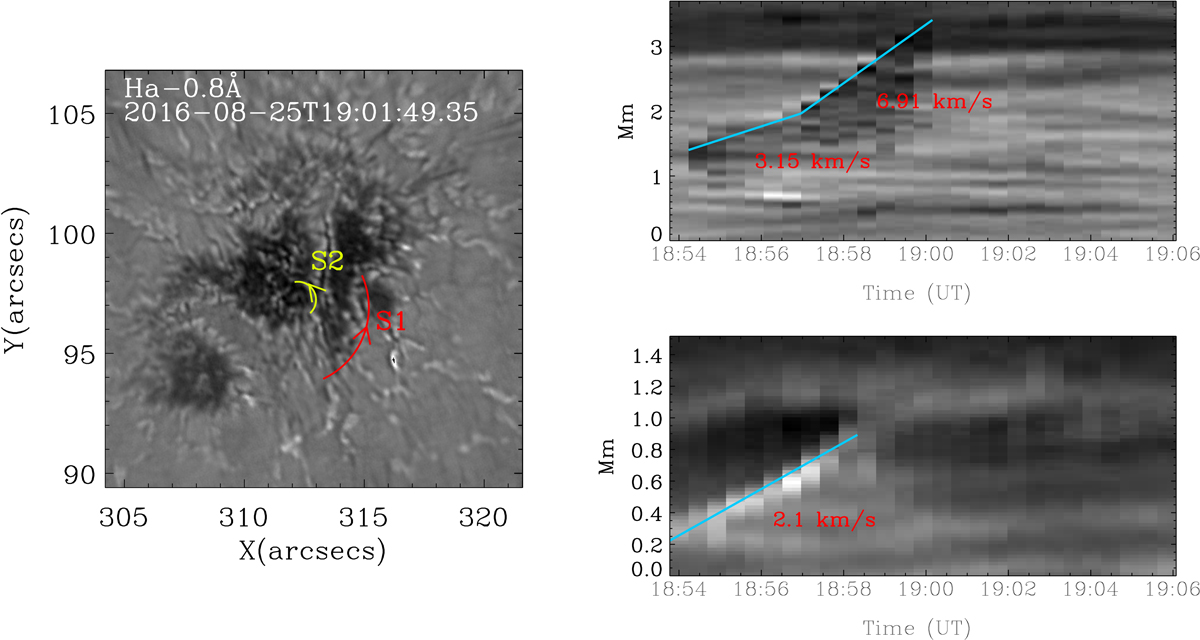
Fig. 2.
Download original image
Time slice diagrams in two slices marked in the Hα blue wing image at −0.8 Å (left panel). The right panels, from top to bottom, show the plasma trajectories moving along the S1 and S2 slices, respectively. S1 indicates the sweeping motion of the front of the jet and S2 the slipping motion of the bright footpoint of the jet, which ultimately invades the sunspot umbra. The footpoint of the jet moves by about 2.1 km s−1 which is around 12° min−1. The top of the jet moves with a speed of 6.9 km s−1.
Current usage metrics show cumulative count of Article Views (full-text article views including HTML views, PDF and ePub downloads, according to the available data) and Abstracts Views on Vision4Press platform.
Data correspond to usage on the plateform after 2015. The current usage metrics is available 48-96 hours after online publication and is updated daily on week days.
Initial download of the metrics may take a while.