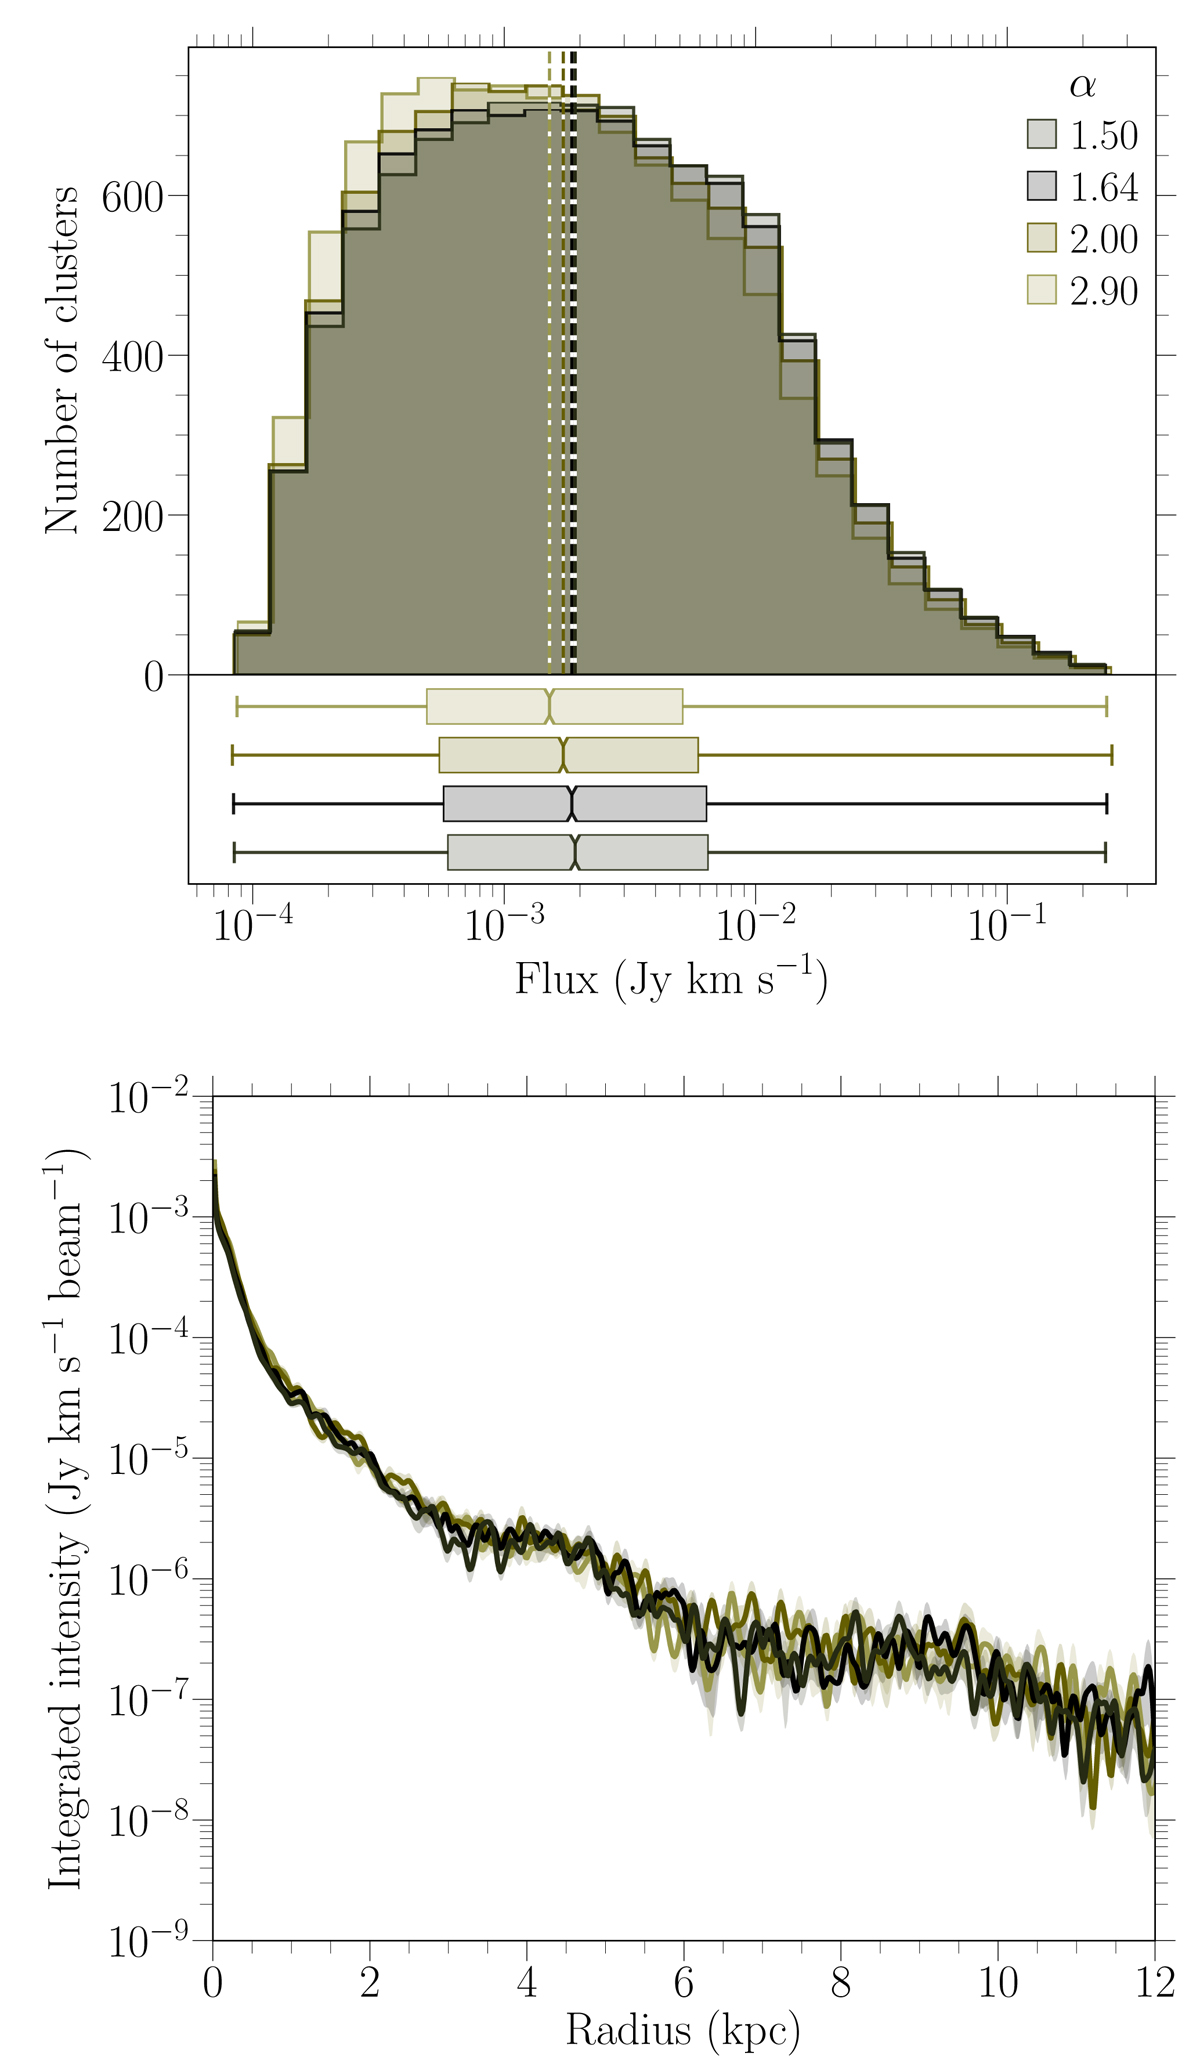
Fig. 6.
Download original image
Results of multiple model runs with varying power-law slopes α of molecular cloud mass distributions. Top: distributions of cluster emission derived for simulations with different power-law slopes α of molecular cloud mass distributions. The vertical dashed lines correspond to the median flux of each distribution. In the bottom box plot the interquartile ranges are presented. The notches in the boxes indicate the 95% confidence intervals around the median. The whiskers spread to the beginning (0%) and the end (100%) of the distributions. These are the mean distributions from a series of ten simulations for each varying parameter. Bottom: radial profiles of emission from the galaxies of the corresponding α values. The radial profiles were calculated from the center of the galaxy all the way to its outskirts. The solid lines correspond to the mean profiles derived from ten simulations, while the shaded regions represent the spread of the mean values based on their standard deviations.
Current usage metrics show cumulative count of Article Views (full-text article views including HTML views, PDF and ePub downloads, according to the available data) and Abstracts Views on Vision4Press platform.
Data correspond to usage on the plateform after 2015. The current usage metrics is available 48-96 hours after online publication and is updated daily on week days.
Initial download of the metrics may take a while.