Fig. 3.
Download original image
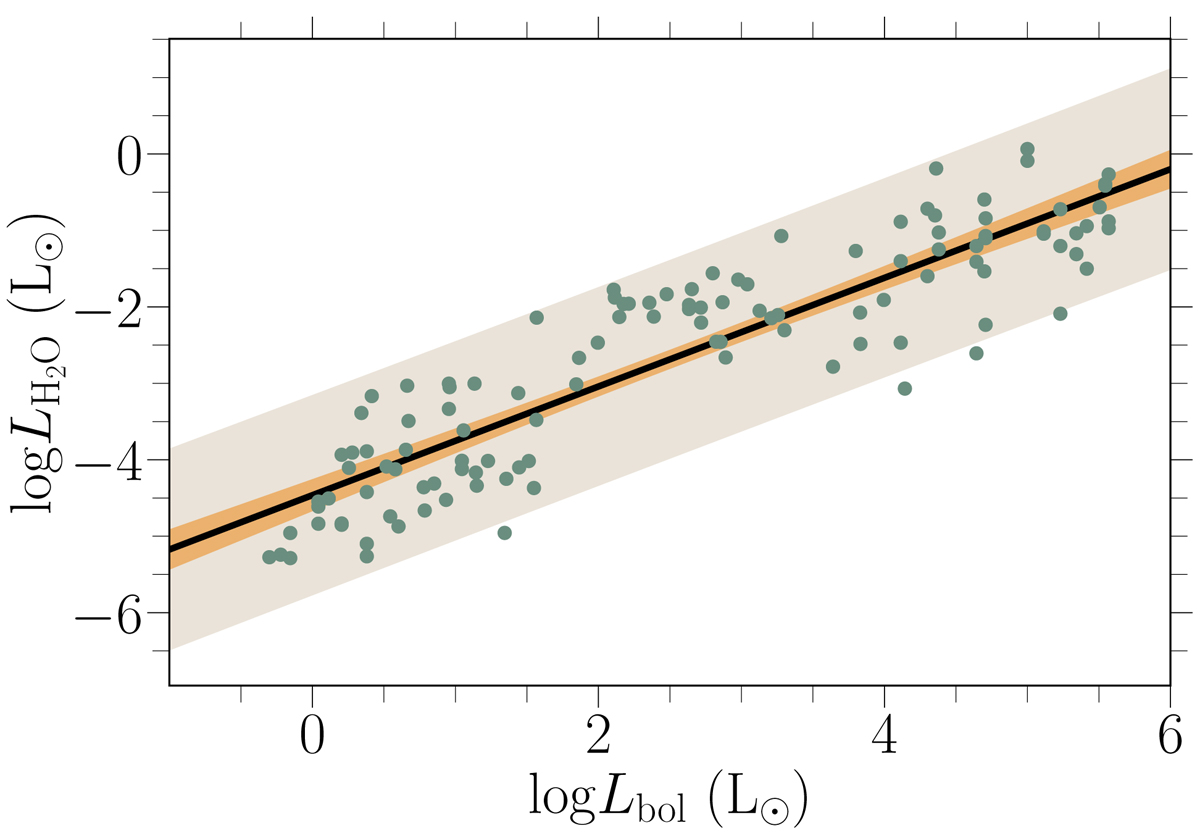
Water line luminosity at 988 GHz vs. bolometric luminosity for objects from WED used in the simulations, with inclusion of a few additional sources that were excluded from the simulations due to lack of Menv data (San José-García 2015). The solid black line shows the best-fit proportionality, the orange filled region corresponds to the 95% confidence region of the correlation, and the shaded red region represents the region that contains 95% of the measurements.
Current usage metrics show cumulative count of Article Views (full-text article views including HTML views, PDF and ePub downloads, according to the available data) and Abstracts Views on Vision4Press platform.
Data correspond to usage on the plateform after 2015. The current usage metrics is available 48-96 hours after online publication and is updated daily on week days.
Initial download of the metrics may take a while.